Investing.com’s stocks of the week
Pre-Open Market Analysis
Yesterday was a strong bear trend day, and there was very little overlap with Tuesday, which was a strong bull day. This is a bull trap and it increases the chance of lower prices.
However, these big reversals up and down on the daily chart create confusion. That will probably result in the Emini continuing in a trading range for at least a couple more weeks.
I wrote over the weekend that last week was a weak buy setup on the weekly chart. I said that there would probably be more sellers than buyers above its high. And there were. This week might even go outside down.
I mentioned last week that the Globex Emini traded below 2800 but that the day session did not. That is a Big Round Number and a magnet. I said that these factors increase the odds that the day session would have to trade below 2800 as well.
Was yesterday the start of that test? Well, nothing is clear in a trading range. The only thing that traders believe is likely is that every strong move up or down will soon reverse and not lead to a trend. Bottoms and tops typically are not clear.
What will happen today? The bull trap on the daily chart and the magnetism of last week’s low and 2800 makes at least slightly lower prices likely within a few days. But day traders have to be ready for anything when the daily chart is in a trading range. After yesterday’s sell climax, there will probably be at least a couple hours of trading range price action. Since there are now 2 legs down from last week’s high, today could even be a bull trend day.
Is Inverted Yield Curve A Buy Signal?
Yesterday was the 1st time in 10 years when the interest rate on the 10 year note was less than that on the 2 year note. This is an inverted yield curve. That is important because an inverted yield curve typically leads to a recession.But that recession usually begins 1 – 2 years later. In fact, once the yield curve inverts, the stock market is up an average of 12% one year later. Therefore, one could argue that it is a buy signal for the next year.Overnight Emini Globex Trading
The Emini is up 11 points in the Globex session. Since yesterday was a sell climax day, there is a 75% chance of at least 2 hours of sideways to up trading that starts by the end of the 2nd hour today.
Traders know that the daily chart is in a trading range. They expect bad follow-through after strong trend days up and down. Yesterday closed on its low and had very little overlap with Tuesday. Tuesday was a big bull day. That type of bull trap typically has follow-through selling for at least a few days.
But context is important. The daily chart is in a trading range. Traders expect reversals and not trends. That reduces the chance of a follow-through bear trend day today. Day traders will be ready for anything today. However, they are confident of at least a couple hours of sideways to up trading at some point.
Yesterday’s Setups

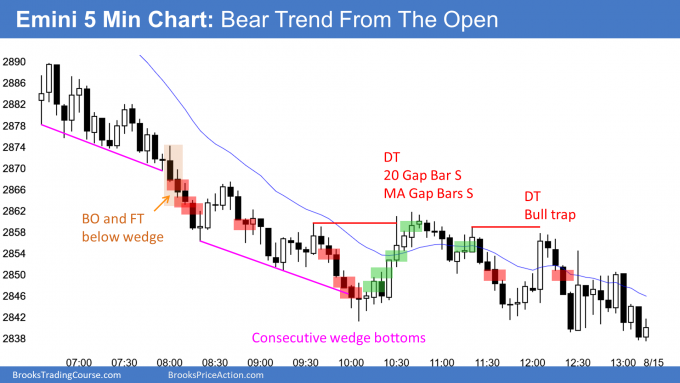
Here are several reasonable stop entry setups from yesterday. I show each buy entry with a green rectangle and each sell entry with a red rectangle. I rarely also show limit order entries and entries on the close of bars. Buyers of the Brooks Trading Course and Encyclopedia of Chart Patterns have access to a much more detailed explanation of the swing trades for each day.
My goal with these charts is to present an Always In perspective. If a trader was trying to be Always In or nearly Always In a position all day, and he was not currently in the market, these entries would be logical times for him to enter.
