Investing.com’s stocks of the week
Emini and Forex Trading Update:
Pre-Open market analysis
Yesterday gapped down on the daily and weekly charts and sold off from the open. The gap might lead to a measured move down to near the June low.
However, yesterday is also at the support of the June 12 low. That was the 1st pullback in the June rally and is a common target for the bears. The market often begins to enter a trading range there.
In addition, the selloff is around a 50% pullback of the 2 month rally. Furthermore, it tested the 2800 Big Round Number and fell 100, which is also a Big Round Number. Finally, it reached a measured move down below the July 31 low. The bears will probably cover some of their shorts around here. This could lead to a 1 – 3 day rally.
But, the bears will probably sell the 1st rally and most bulls will only buy for a brief short-covering rally. Consequently, they, too, will probably look to sell after a 1 – 3 day bounce.
Overnight Emini Globex trading
The Emini sold off to below 2800 overnight and then reversed up 90 points. This means that the bears are starting to take profits. A profit-taking rally was likely to begin either today or tomorrow after 4 huge bear trend days down to a support zone.
Because the selloff was so extreme, traders do not much downside risk today. But the bears will probably sell the first 1 – 3 day rally. Strong reversals in strong bear trends create confusion. The result is usually more trading range trading.
Since the daily ranges have been huge, the legs in a trading range initially might be more than 50 points. Also, the bars on the 5 minute chart will probably continue to be big. Therefore, day traders will have swing trades up and down, despite what will likely be the start of a trading range for a few days.
Yesterday’s setups

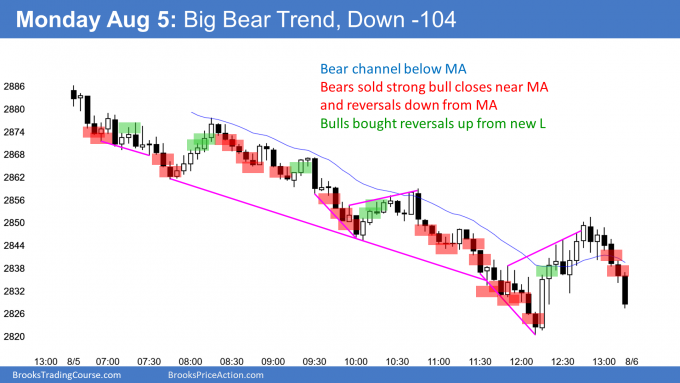
Here are several reasonable stop entry setups from yesterday. I show each buy entry with a green rectangle and each sell entry with a red rectangle. I rarely also show limit order entries and entries on the close of bars. Buyers of the Brooks Trading Course and Encyclopedia of Chart Patterns have access to a much more detailed explanation of the swing trades for each day.
My goal with these charts is to present an Always In perspective. If a trader was trying to be Always In or nearly Always In a position all day, and he was not currently in the market, these entries would be logical times for him to enter.
