Market Overview: Weekend Market Update
The Emini reversed up from a bear trap last week. It should test the top of last week’s sell climax at a minimum.
Bond futures reversed most of the September pullback and are likely to go at least a little higher.
Bitcoin has a minor bottom but should fall below 7,500 within a month.
30 year Treasury Bond Futures market:
ii bull flag
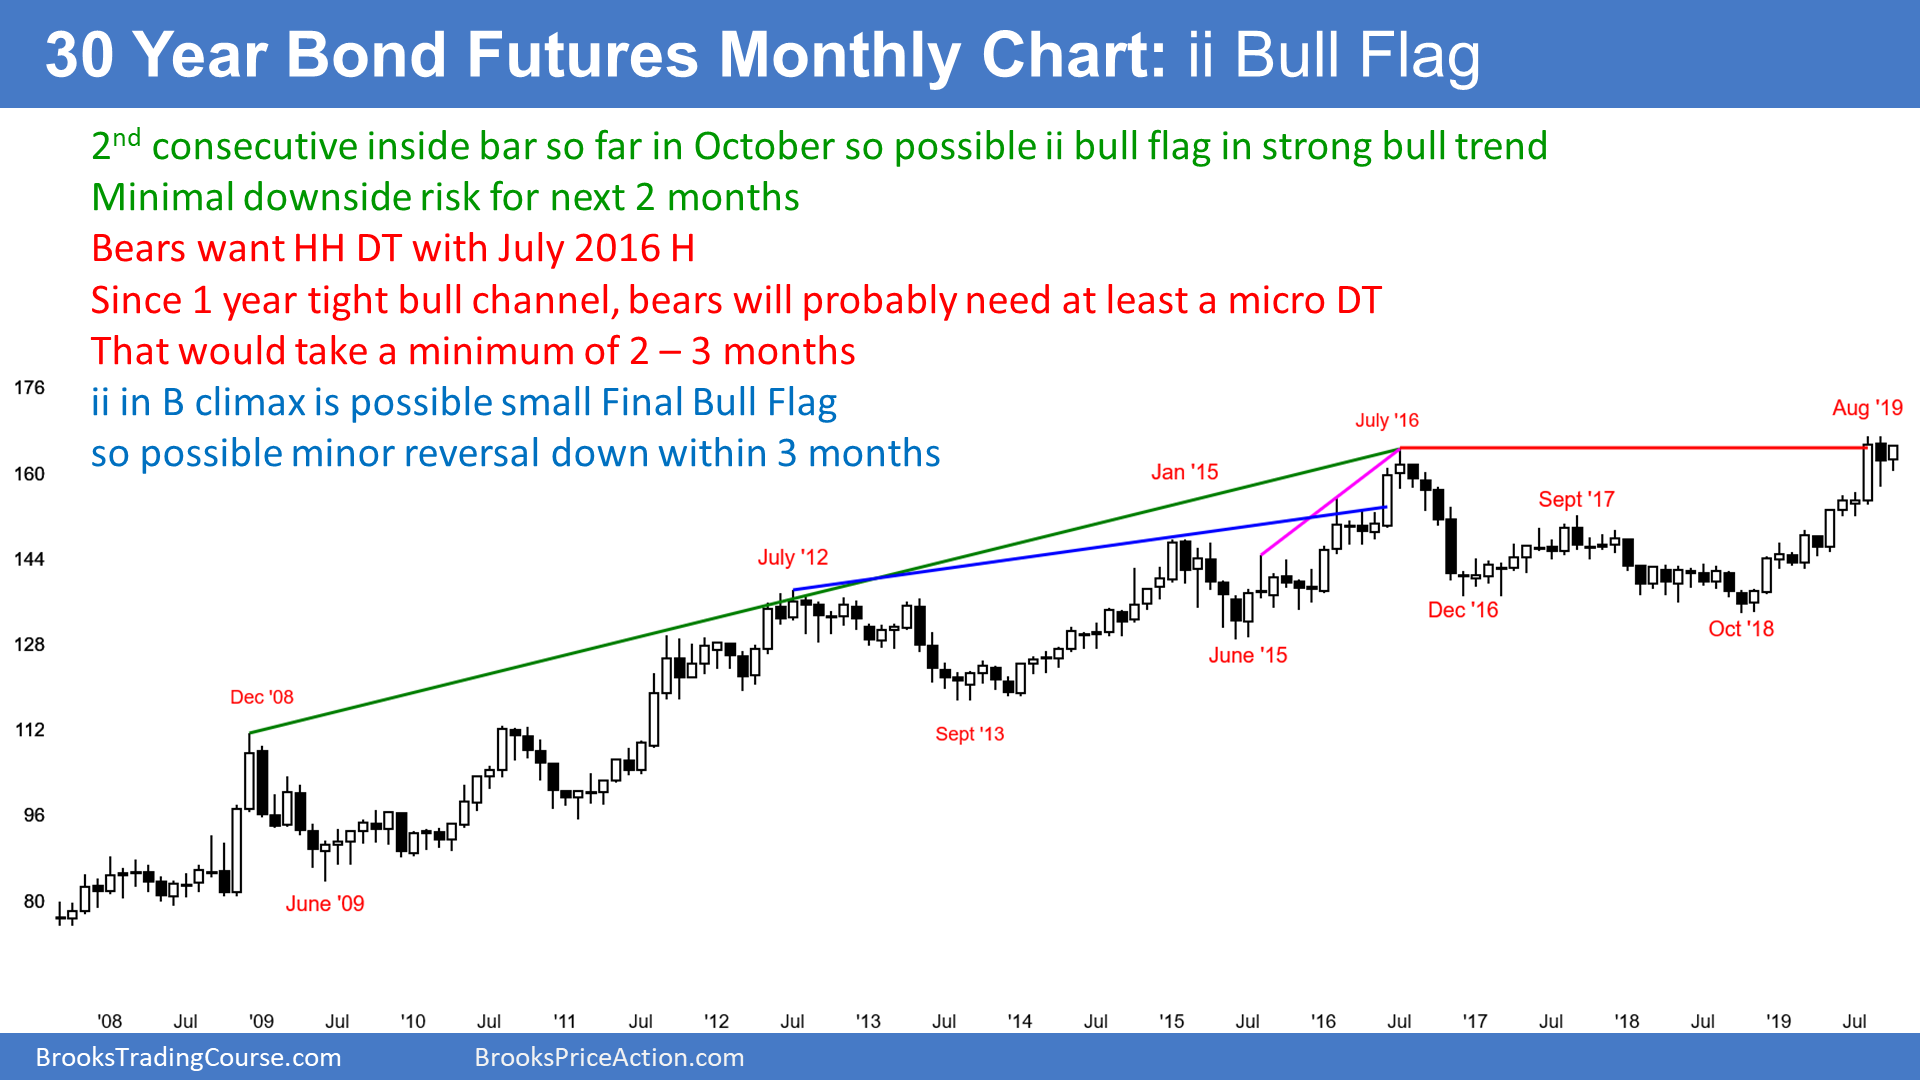
The 30-Year Treasury bond futures monthly chart has an inside bar so far in October. September’s low was above the August low and its high was below the August high. September is therefore also an inside month.
Consecutive inside bars (an ii pattern) is a Breakout Mode pattern. When they form in a strong bull trend, there is usually a bull breakout.
However, they represent balance. Consequently, the upside is frequently small. They therefore often form a Final Bull Flag.
That makes sense because the sideways trading indicates that both the bulls and bears believe the price is fair. A breakout above usually gets pulled back into the ii within a couple months.
What happens if October goes above September instead of remaining an inside bar? The same result. September is a bear bar in a buy climax. It is therefore a weak buy signal bar. Traders will expect more sellers than buyers above its high.
Consequently, the upside is probably small over the next couple months. This is true whether October goes above September or if there is an ii bull flag.
Interest rates will not hit zero
Wall St. often likes catchy phrases. Most have a small element of truth. However, most end up as not true. A recent example is, “Gold to infinity and interest rates to zero.”
Interest rates to zero requires bond prices to go to infinity. No one expects that, but some expect gold and bonds to go much higher.
I have written many times that I doubt interest rates will ever be negative in the US. Americans would not let it happen. We see ourselves as the leader of the economic world and that would represent an unacceptable level of failure and embarrassment. The Fed has many tools to prevent it.
Since Americans will never accept it, it will not happen. Think about it. What would the seniors and AARP do if seniors on fixed incomes had to pay interest to a bank for the right to have a savings account?
Bitcoin daily chart:
Weak bottom with the magnetic pull of support below
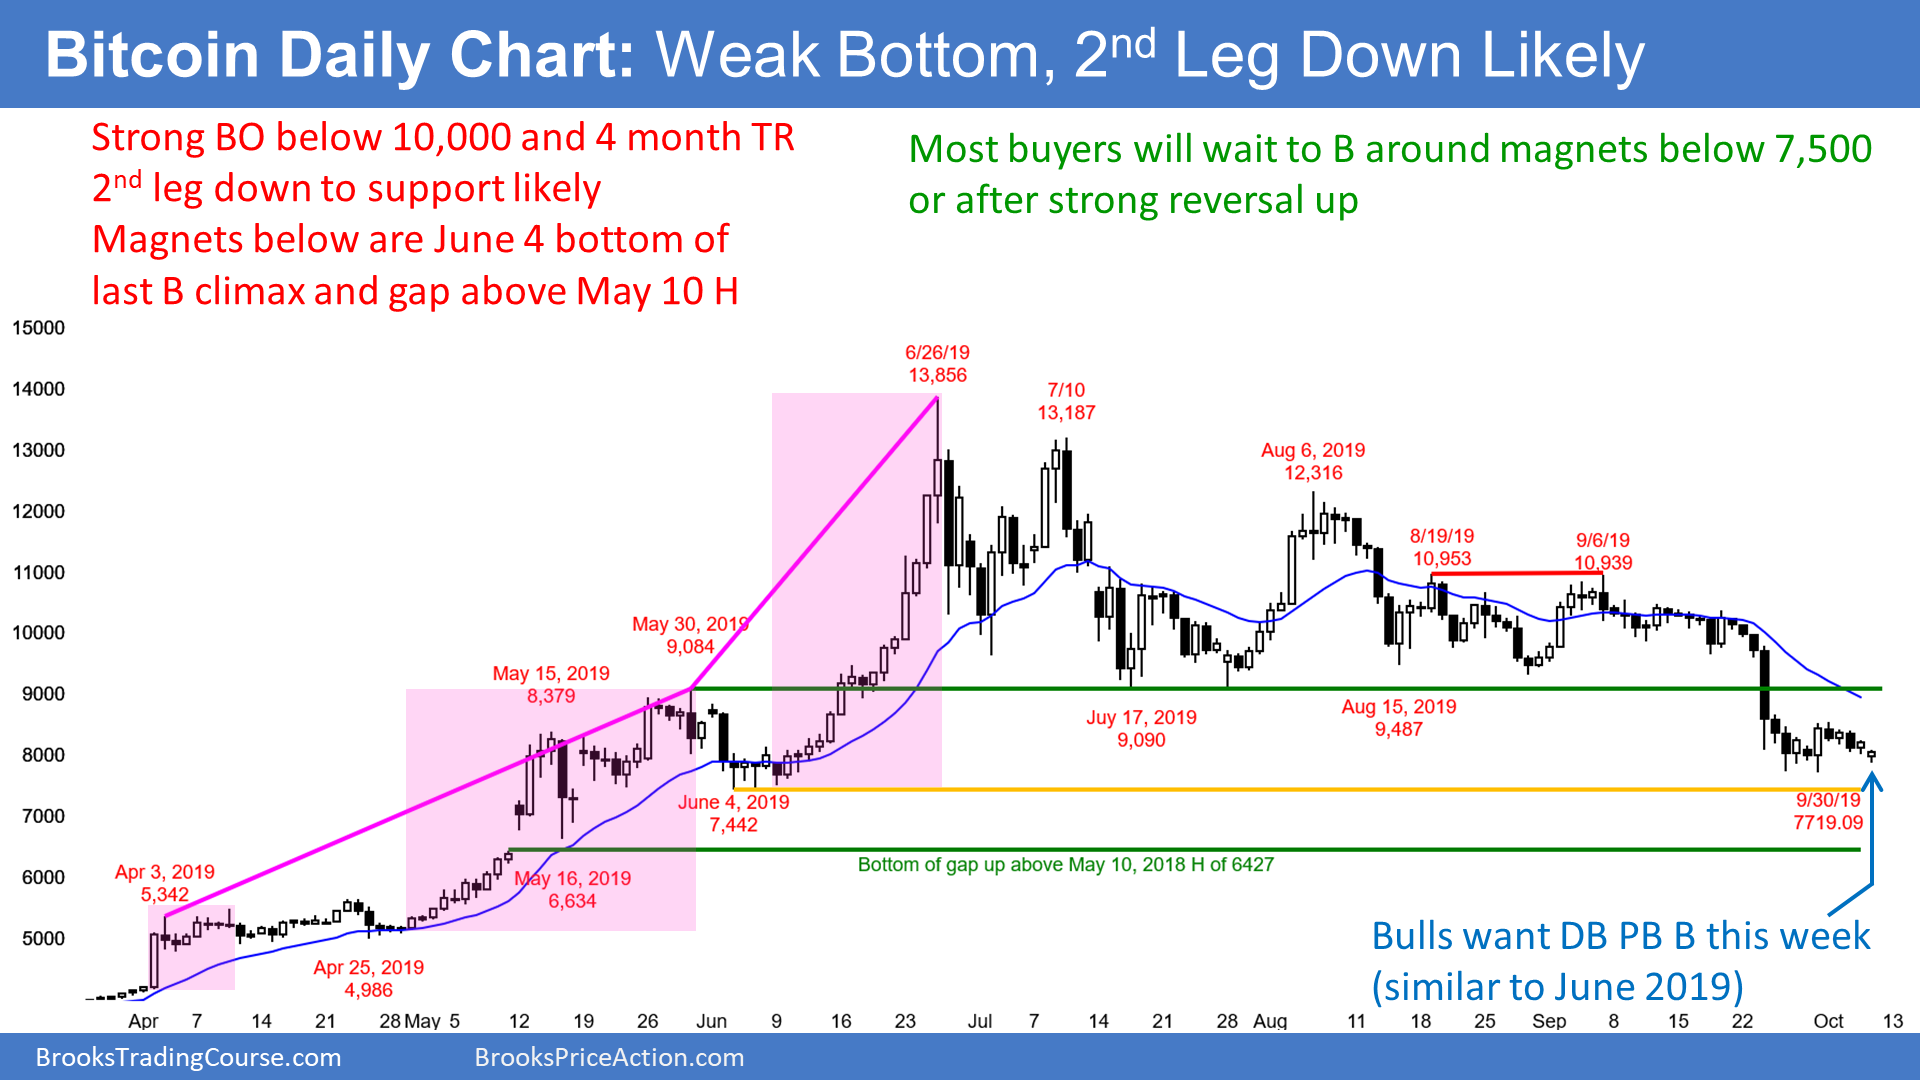
The Bitcoin cash index daily chart collapsed below 10,000 two weeks ago. I wrote on August 24 that 10,000 was fake support and that Bitcoin would probably have to test 7,500 before strong buyers would look to buy. It was way too easy to buy with limit orders at 10,000 for 3 months.
Traders should always assume that an institution is taking the other side of every trade. Why? Because they are 95% of the volume in most markets. That is not yet true in Bitcoin, but it is true enough.
Whenever you find it easy to do something, then institutions are eager to do the opposite. The result is that you will typically lose money. “Good fill, bad trade.” This is a good example.
Ledge at 10,000
Whenever a market hits a price 4 or more times in a trading range, that price is a ledge. When there is a ledge on the daily or weekly charts, there is a high probability of 2 things. First, there is a 70% chance of a break beyond the ledge. Next, there is a 70% chance of a pullback through the ledge breakout point. That pullback usually comes within 10 – 20 bars, but it can come sooner or much later.
There was a ledge bottom at the 10,000 Big Round Number, which was psychological support. That is now resistance, but resistance is a magnet. Traders should expect at least a small test above 10,000. It will probably come within a couple months, but it might take many months.
Once the market gets back above 10,000, traders will then decide if there will be a continued bear trend or a resumption of the 2019 rally. If there is a rally, traders will see the break below 10,000 as a bear trap in a bull trend.
Support between 6,400 and 7,500
Whenever there is a reversal down from a buy climax (like in June), traders expect a test of the bottom of the most recent leg up. That began with the June 4 low of 7,442 and that is why I said that Bitcoin was going to fall below 7,500. This is despite the pundits claiming that the 4 sideways months was forming a base that would lead to 20,000, 50,000 or even a million.
Additionally, I said that the selloff might close the gap above the May 10 high. Also, the bulls might wait for it to test the April 25 low, which is the bottom of the 2nd leg up in the parabolic wedge rally. The gap above the May 10 high of 6,427 is another magnet within reach.
Pullback in bull trend more likely than bear trend
Reversals from wedges often go to the start of the wedge, which is the December low of 3,135. While possible, that would indicate that the bull trend is over. Unless it falls there, the selloff is still more likely a pullback from the 2018 rally. Therefore, there will probably be at least one more rally to above 10,000 within 3 – 6 months.
The bulls want the rally to be the resumption of the bull trend. However, that rally would be almost as likely to be a bull leg in a trading range that could last for years.
The bears want the June rally to be a lower high in a bear trend. They therefore want a selloff to below the bottom of the bull trend. That is the December 14, 2018 low of 3,135. If the bears achieve their goal, then Bitcoin will probably be in a trading range between 3,000 and 10,000 – 14,000 for several years.
Monthly S&P500 Emini futures chart:
Weak bull flag at top of 22 month trading range
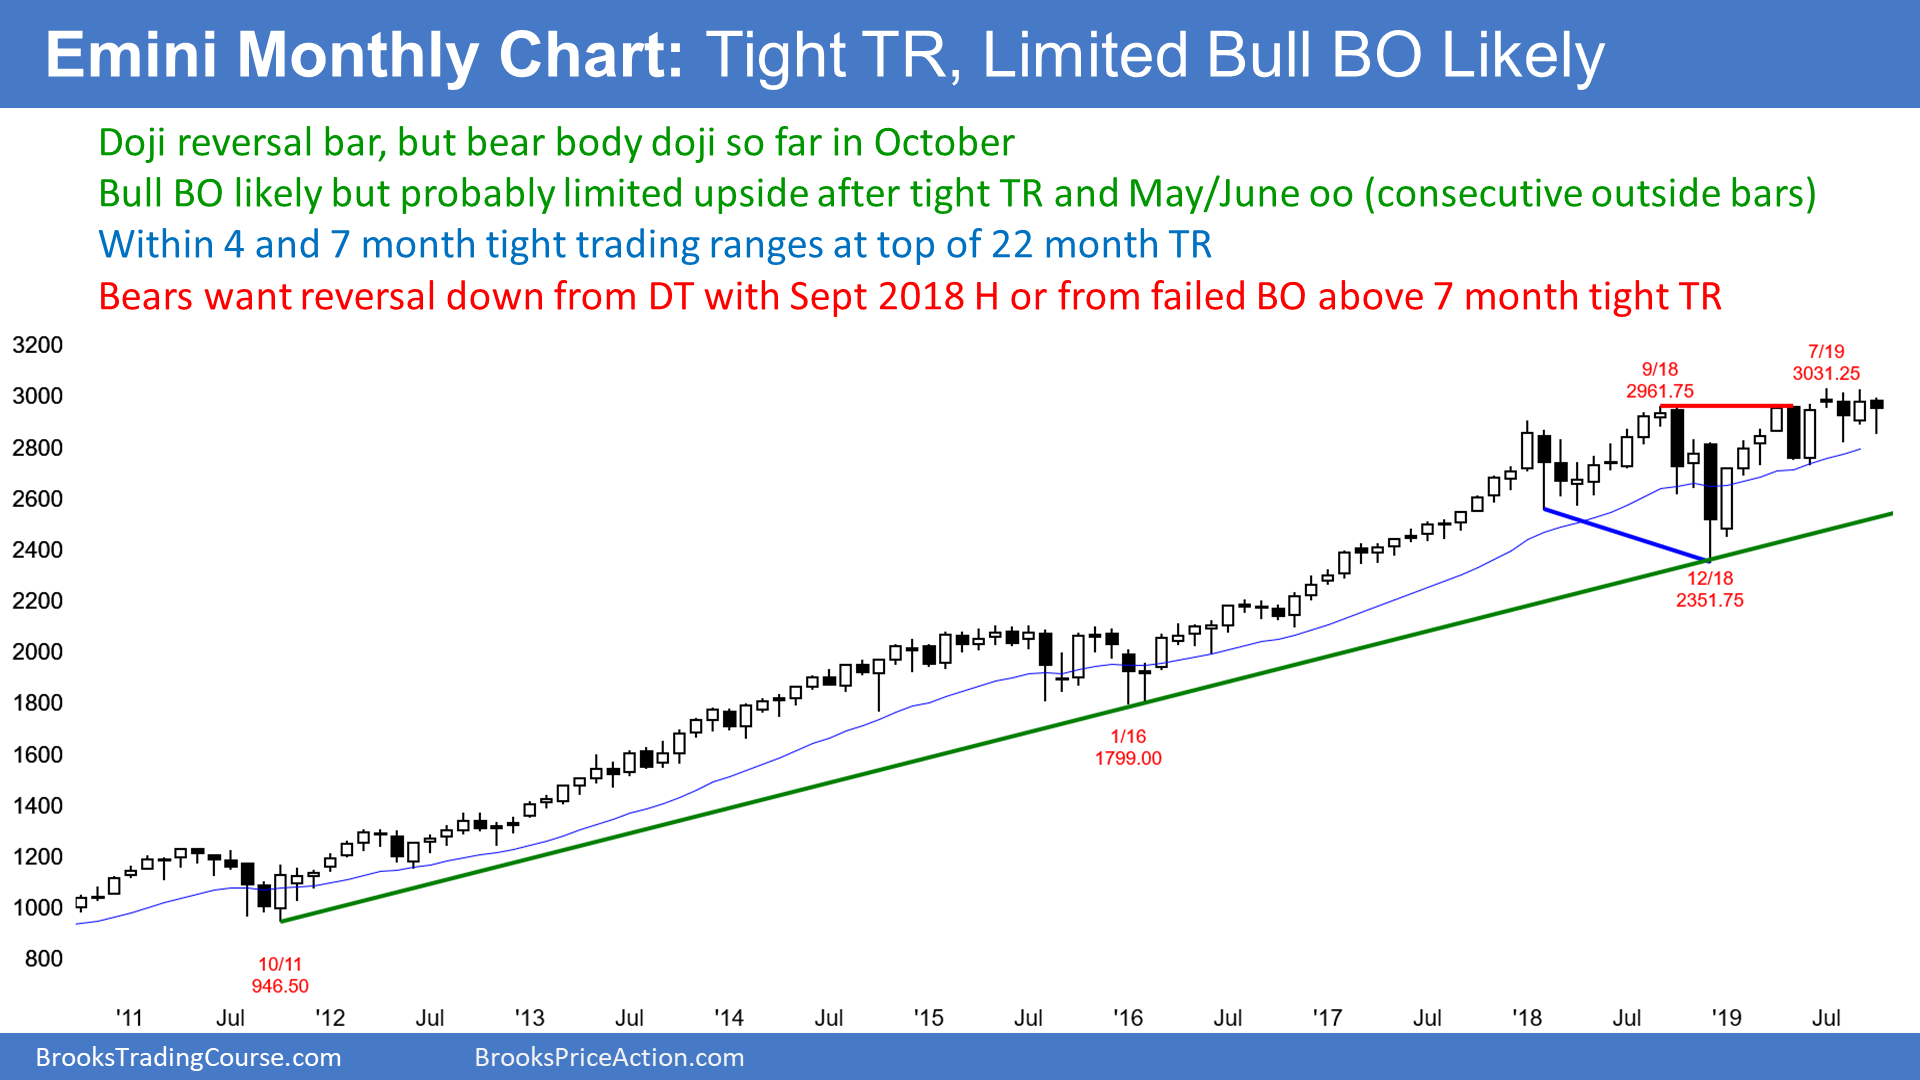
The monthly S&P500 Emini futures chart so far has a bear doji in October. This is now the 4th month in a tight trading range. That range is within a 7 month tight trading range and at the top of a 22 month trading range.
But these trading ranges are within a 10 year bull trend. Consequently, the odds still favor at least slightly higher prices.
Trading ranges represent an area of agreement. Therefore, breakouts usually do not get far before there is a reversal back into the range.
The bulls hope that the past 2 years will be like 2014-5. The breakout above that trading range had many consecutive bull bodies. When that happens, the odds favor another leg up.
Will there be a similar breakout this time? Probably not. The past 4 months have had small bodies and prominent tails. That is not how strong trends usually begin.
Furthermore, I have written many times about the oo (consecutive outside bars) in June and May. May was an outside down bar and then June went outside up. That was an oo bull flag. The breakout above an oo bull flag usually last at least 3 months, as this one has. But it typically does not begin a strong leg up. Therefore, if the bull trend resumes from here, the rally will probably fail within a few months.
Weekly S&P500 Emini futures chart:
Weak double bottom in bull channel
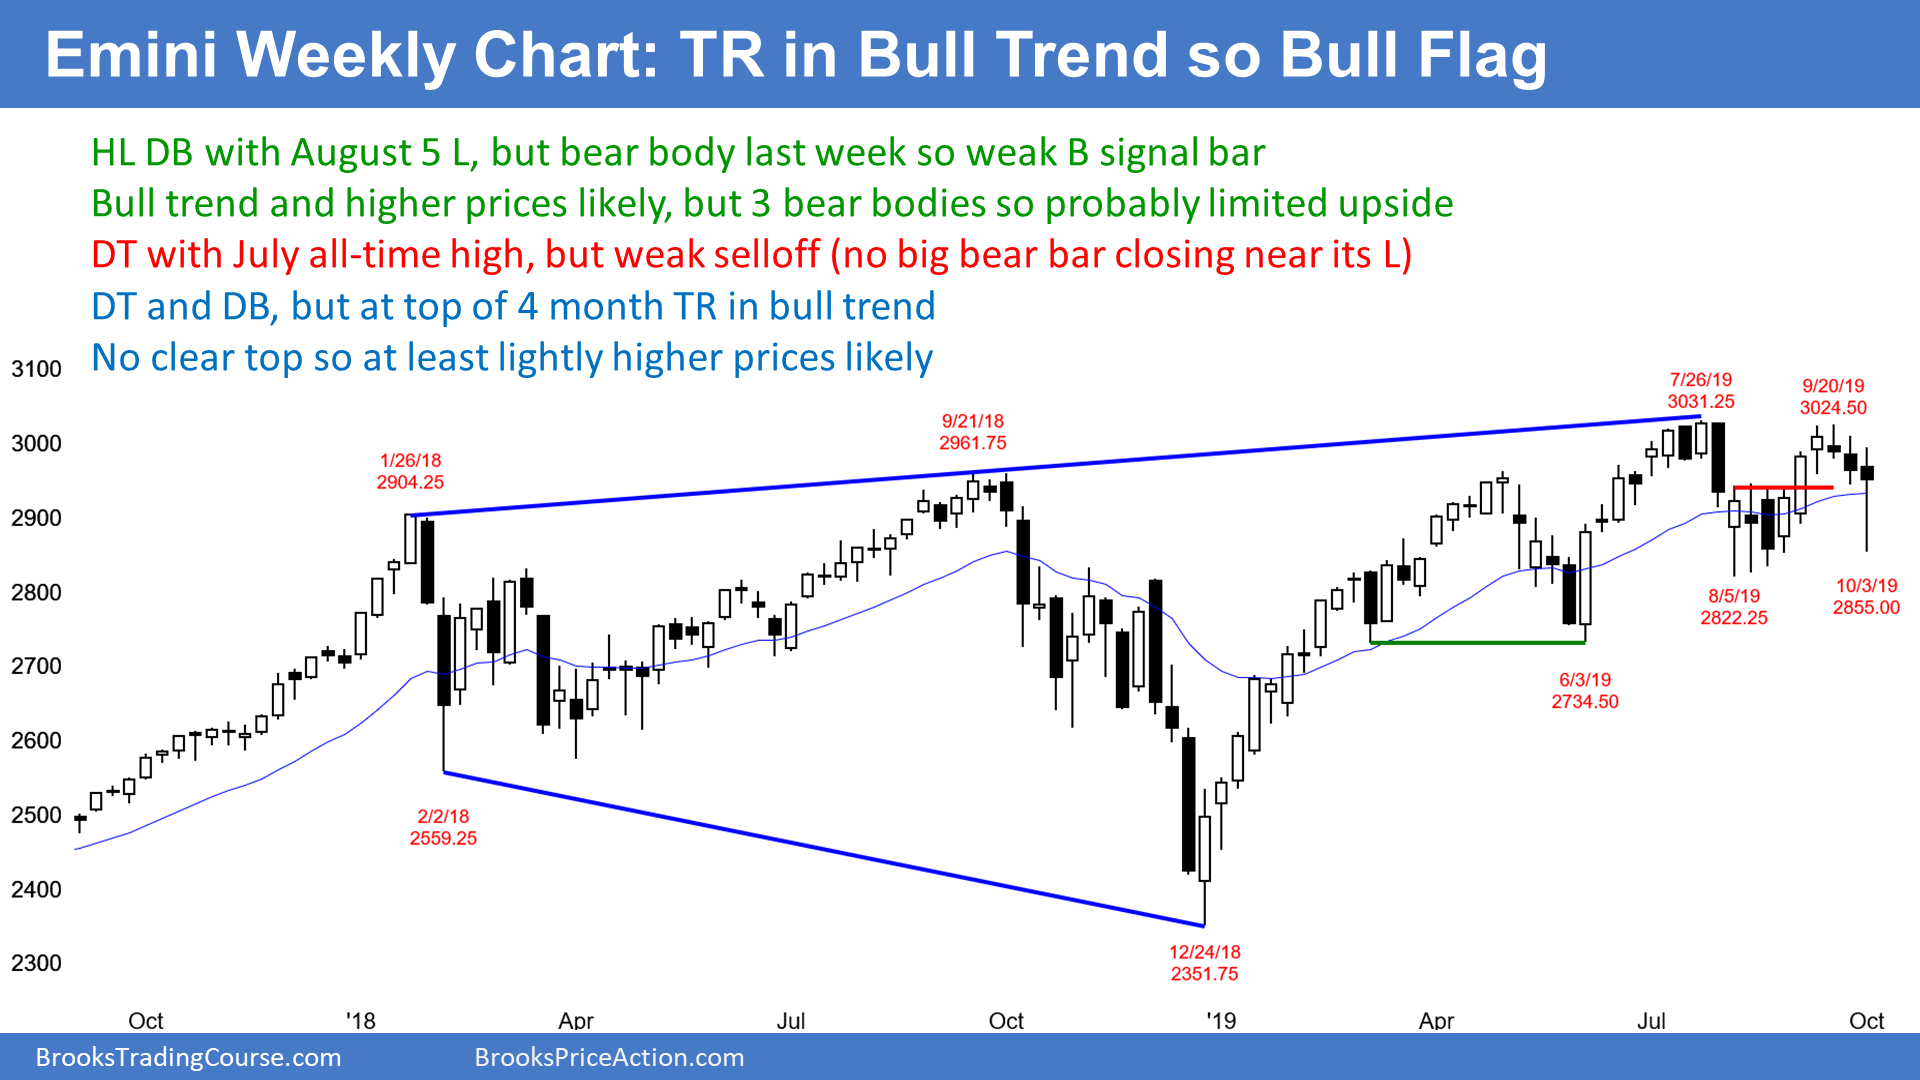
The weekly S&P500 Emini futures chart reversed up last week, but the candlestick had a bear body. That is a weak buy signal bar for this week. In addition, it was the 3rd consecutive bear bar and its high is at the top of a 4 month range within a 22 month range. That is not a strong context for a big rally.
I have been saying since June that there would probably be a new all-time high in September or October. Because of the nested trading ranges, it might take longer.
The past 2 months now have a lower high double top and a higher low double bottom. Traders now will wonder if there will be one more lower high over the next week or two, which would convert the 2 month range into a triangle.
Because the current trading range is also a bull channel after the 2019 strong rally, traders still expect higher prices. But unless the bulls get several consecutive bull bars, the upside breakout will probably not get very far.
Weak head and shoulders top major trend reversal setup
The bears see the September lower high as the right shoulder of a head and shoulders top. The May lower high is the left shoulder. They hope for a break below the 4 month range and then a measured move down to around the Christmas low.
When there is a strong sell signal bar, the bears have a 40% chance of a swing down. However, the sell signal bar 3 weeks ago was a doji, not a bear bar closing on its low. Also, the entry bar 2 weeks ago had a small body. Last week was the follow-through bar. While it had a bear body, it closed above its midpoint. It is therefore a reversal bar and a buy signal bar for next week.
As a result of these factors, the bears currently have only a 30% chance of a swing down. Their odds will go up if they can suddenly get one or two big bear bars closing near their lows. Without that, the odds favor a bull breakout. But there might be more sideways trading 1st.
Daily S&P500 Emini futures chart:
Strong reversal up from bear trap
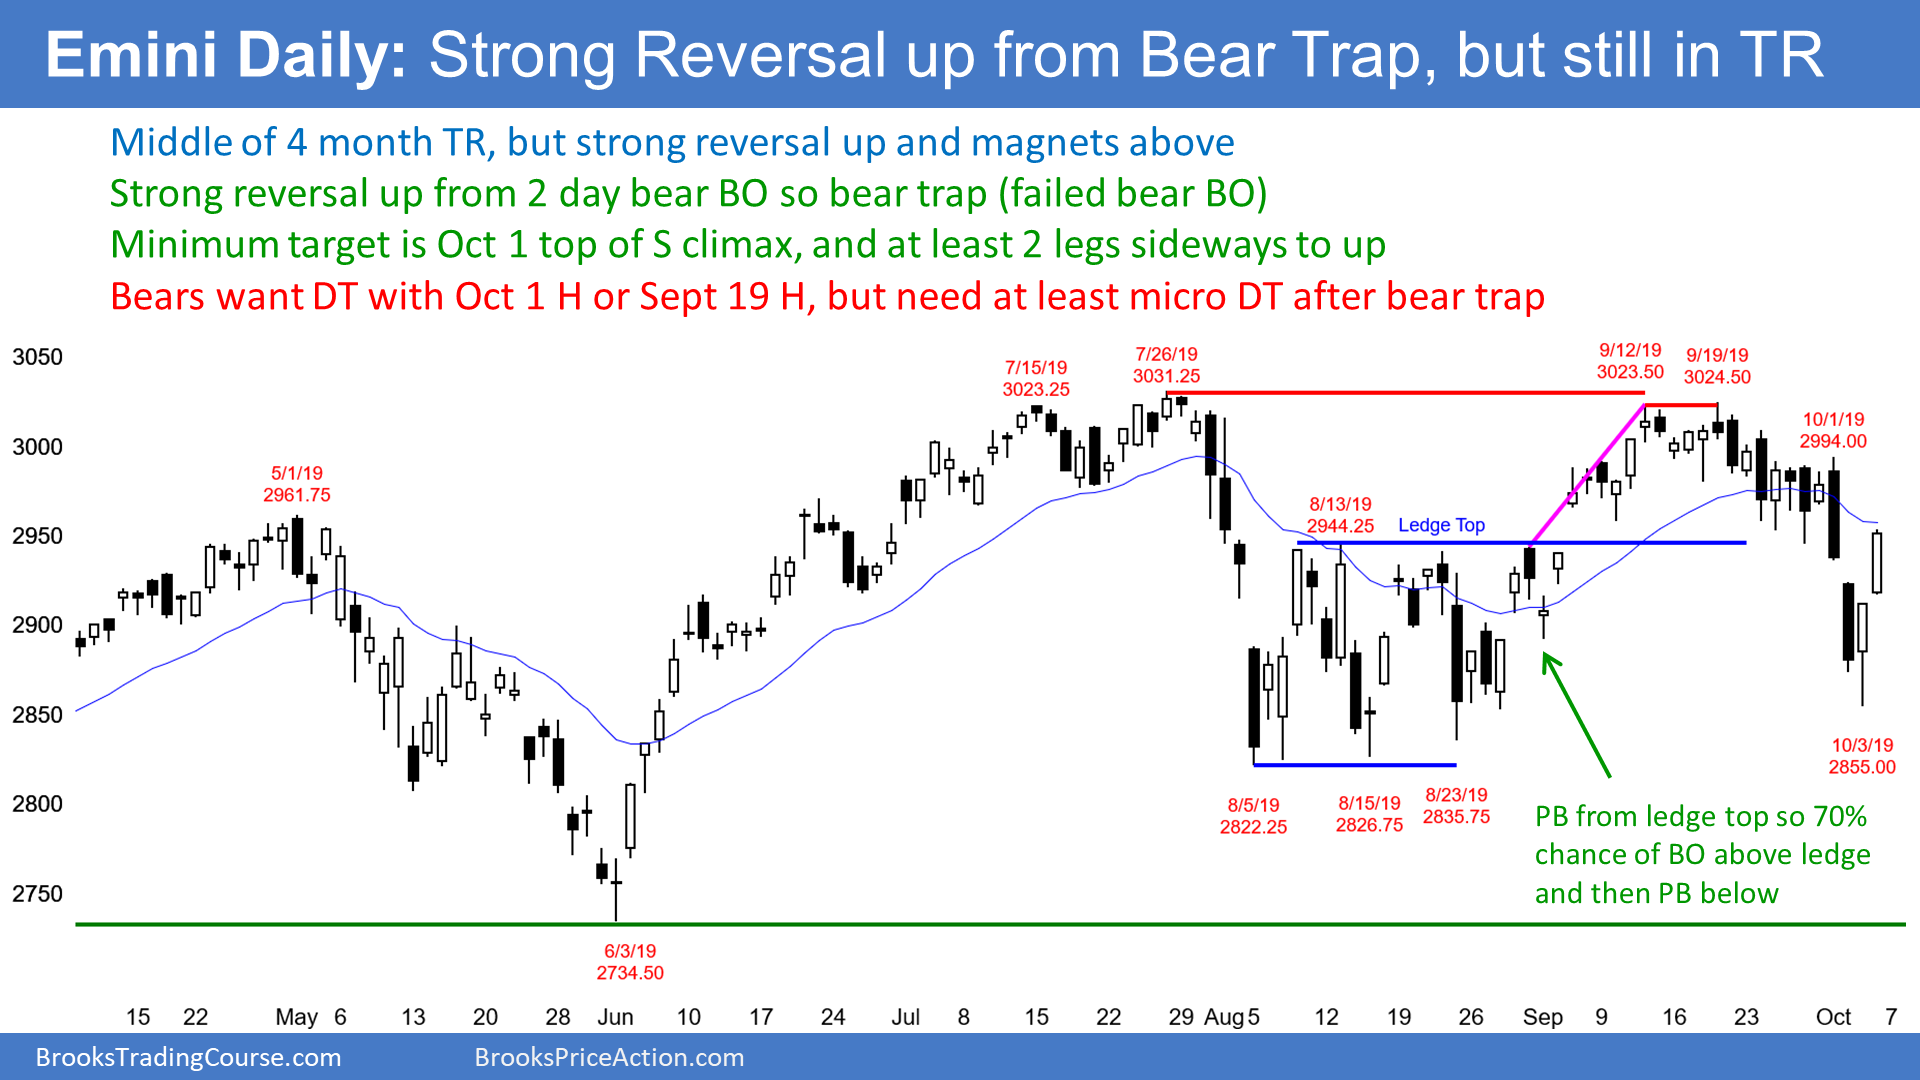
The daily S&P500 Emini futures chart sold off with 2 big bear bars this past week. However, it also reversed up sharply. Both bull bars had big bodies and closed near their highs.
The selloff was therefore a bear trap. A trap typically has at least 2 legs up. In addition, the reversal usually tests the top of the sell climax, which is the October 1 high of 2994.00. Consequently, the odds favor higher prices over the next week or two. Also, traders expect the 1st reversal down to last only 1 – 3 days. They will buy the pullback. Until then, most bears will not sell until they see at least a micro double top.
Since the weekly and monthly charts are in bull trends, the odds favor higher prices. Remember, on the daily chart, at least a small 2nd leg sideways to up is likely after the bear trap. But with the bull trends on the weekly and monthly charts, the Emini will probably make a new all-time high within a couple months.
Ledge top was support
Traders might remember that on September 3, I said that there was a 70% chance of a break above the 2946.00 ledge top. Also, I said that there was a 70% chance of a pullback after that breakout to below the top of that ledge. I expected the pullback within a few weeks. It came last week.
Friday closed on its high and back above the top of the August ledge. The Emini did what it typically does after a wedge top. It breaks out and then pulls back below the top of the ledge. Traders then look for the next pattern.
Because of the bear trap, the odds favor higher prices. But the daily chart has been sideways for 4 months. It might continue sideways for many more weeks before the bulls get their new high. It is important to understand that the new high is still likely within a month or two.
October begins bullish season
There is often a selloff in October. Extreme examples are the stock market crashes in 1929 and 1987. However, when there is a strong selloff in October, there is often a sharp reversal up, and it often lasts for many months. There is an adage, “Sell in May and go away.” What is unsaid is that you eventually look to buy again. Traders often look for a selloff in October to buy theoretically into the next May.
Is this folklore? There is some reality to it. This month’s reversal up is earlier than what is typical, but it is strong enough to be the likely bottom for at least the next month or two. It could last for many months.
