
Pre-Open Market Analysis
On the monthly chart, the Emini has rallied for 3 months. But, the bodies have been shrinking, which indicates a loss of momentum. March had a relatively small range and small body. It therefore increases the chance of a sideways month in April. A sideways month might test last month’s high and low. The low is about 100 points down from the March close. Consequently, there is an increased chance of a 100 point selloff over the next few weeks.
On the weekly chart, last week was a pullback bar in a bull trend. Because it closed with a bull body, it is a buy signal bar. Since there is a 3 month bull trend, this week will probably have to go above last week’s high to trigger the buy. Traders will want to find out if there are buyers or sellers up there.
The weekly chart is still on a sell signal from 2 weeks ago. Both the daily and weekly charts have buy climaxes at the 2825 resistance area. The bulls want this rally to make a new all-time high without more than a minor pullback. It is more likely that there will be a 2 month sideways to down move beginning either with March or April.
Overnight Emini Globex Trading
The Emini is up 20 points in the Globex session. Today will therefore probably gap up on both the daily and weekly charts. If today trades above Friday’s high, which it would with a gap up, it would trigger a buy signal on the weekly chart.
If this week rallies above the high from 2 weeks ago but reverses down, the daily chart would have an expanding triangle top with the March 4 and 21 highs. The bulls need 2 closes above the March 21 high to make a new all-time high likely within the next 2 months.
A big gap increases the chance of a trend day. A gap up makes a bull trend slightly more likely than a bear trend. However, there are bears who will sell around the high from 2 weeks ago. They expect a swing down for a couple of months and are going to sell rallies. We do not know yet if there are more of them than there are bulls wanting a new all-time high.
The past 5 days have had swings up and down. On the daily chart, each has had prominent tails, which indicates the reversals. While today has an increased chance of being a trend day, it is still more likely to have at least one swing up and one swing down.
A big gap up typically results in a trading range for the 1st hour. Day traders look for a double top or bottom, or a wedge top or bottom, and then a 2 – 3 hour swing up or down. That swing can continue all day.
Friday’s Setups
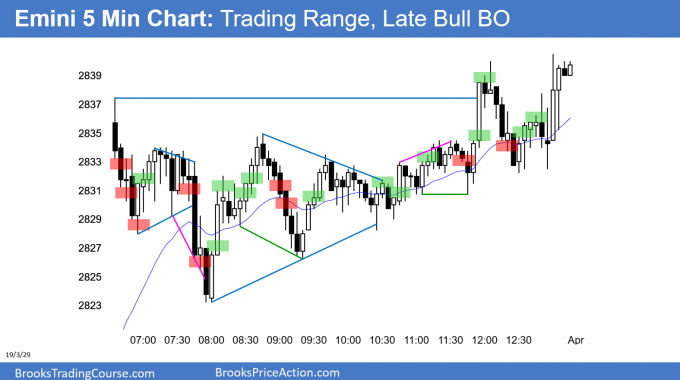
Here are several reasonable stop entry setups from Friday. I show each buy entry with a green rectangle and each sell entry with a red rectangle. I rarely also show limit order entries and entries on the close of bars. My goal with these charts is to present an Always In perspective. If a trader was trying to be Always In or nearly Always In a position all day, and he was not currently in the market, these entries would be logical times for him to enter.