Pre-Open Market Analysis
The Emini gapped down yesterday but then rallied. It was a bull bar on the daily chart and it is a High 1 bull flag buy signal bar for today. Many bulls are waiting to take profits above 3100. Therefore 3100 is a magnet above.
The bulls are continuing to buy small pullbacks, expecting a breakout above 3100 this week. The momentum up is strong enough to make it likely. However, the odds are that the Emini will pull back for a couple weeks at some point in November, just as it has after 4 other rallies this year. The other pullbacks were 5 – 8%. This one will probably be less because of the 5 consecutive bull bars on the weekly chart. The bears will probably need a micro double top before they can get more than a 50 – 100 point pullback.
The 5 consecutive bull bars on the weekly chart is extreme. It increases the chance of a bear bar this week. To get that, the week would have to close below yesterday’s open. Therefore the open of the week might be a magnet all week, especially on Friday.
Overnight Emini Globex Trading
The Emini is unchanged in the Globex session. It is just below the 3100 Big Round Number. There is therefore an increased potential for a strong breakout or a strong reversal.After 2 bull days on the daily chart, The Emini will likely go above yesterday’s high and trigger the High 1 bull flag on the daily chart. But a rally to a new high would be the 3rd small leg up in the past 7 days. That would increase the chance of a reversal down from a micro wedge top within a few days.Also, the past 2 days formed a triangle on the 5 minute chart. A triangle late in a bull trend is often the Final Bull Flag. That is another reason to expect a break above 3100 to reverse down.Finally, this week will probably not form the 6th consecutive bull bar on the weekly chart, which would be unusual. As a result, traders should expect the week to close below the open of the week to create a bear bar on the weekly chart. Consequently, traders should expect at least a small selloff at the end of the week.
Yesterday’s Setups

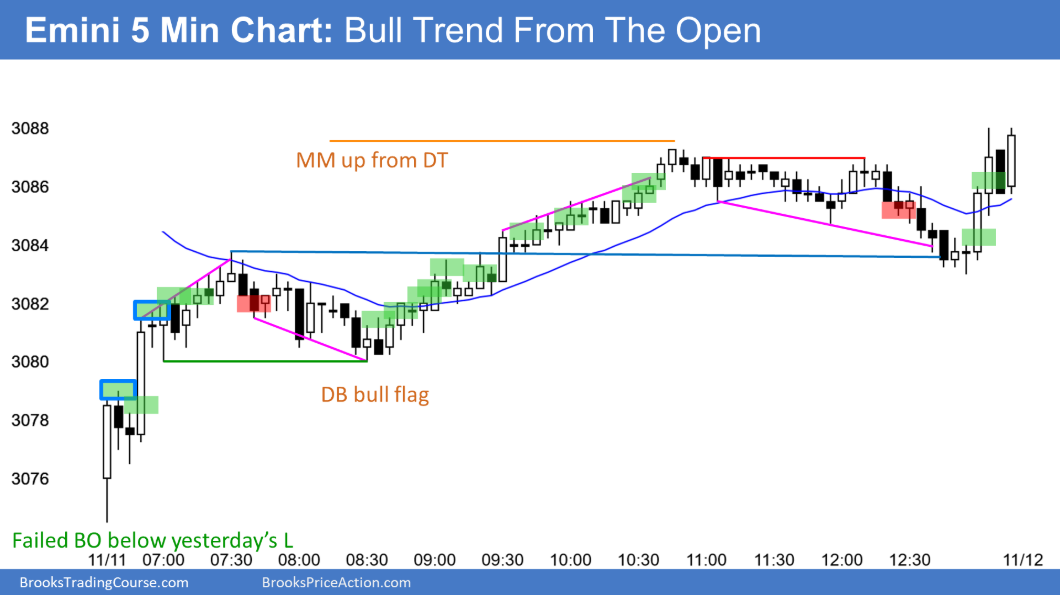
Here are several reasonable stop entry setups from yesterday. I show each buy entry with a green rectangle and each sell entry with a red rectangle. I rarely also show limit order entries and entries on the close of bars. Buyers of the Brooks Trading Course and Encyclopedia of Chart Patterns have access to a much more detailed explanation of the swing trades for each day.
My goal with these charts is to present an Always In perspective. If a trader was trying to be Always In or nearly Always In a position all day, and he was not currently in the market, these entries would be logical times for him to enter.
