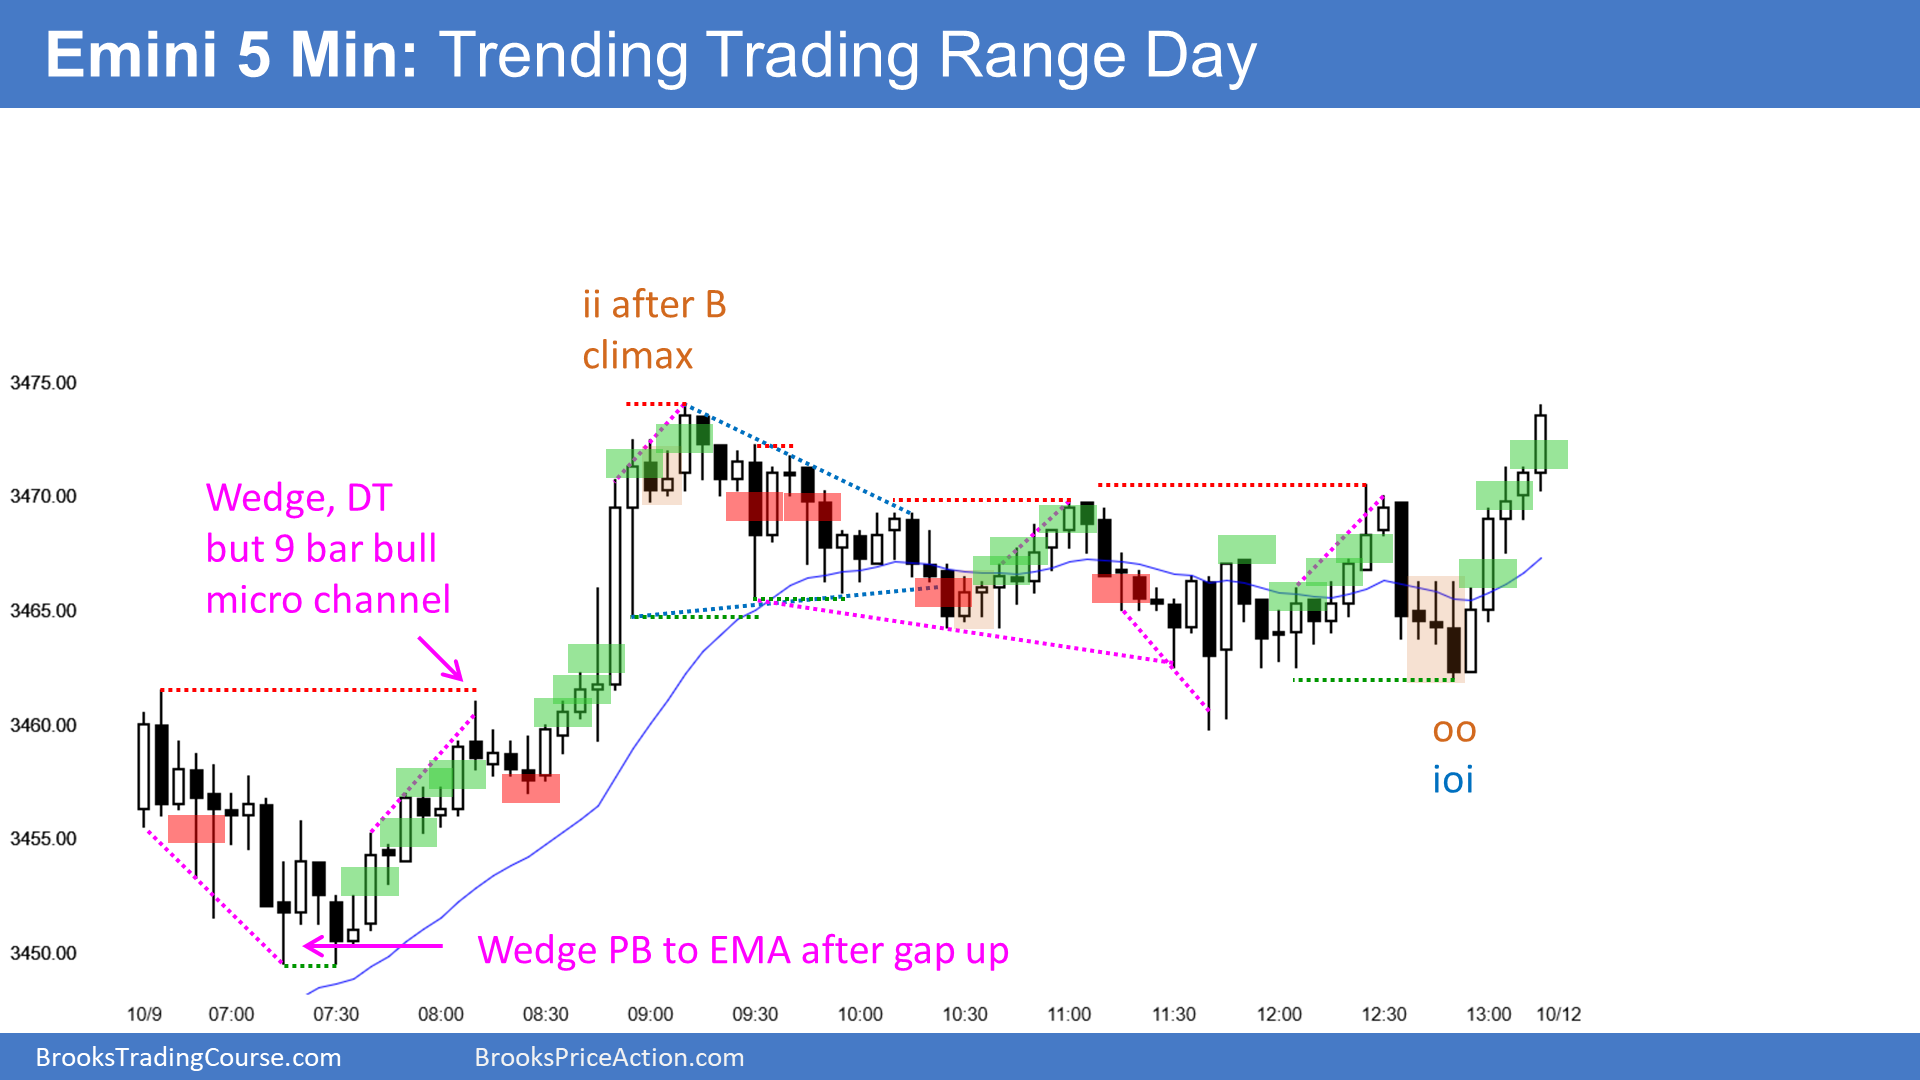
The E-mini broke above the September trading range on Thursday and had a bull follow-through bar on Friday. The E-mini is up in the Globex market and it will probably gap up on the weekly chart. There were several weekly gap up openings in the summer rally. Although most closed before the end of the week, they were a sign of strength and led to higher prices.
The bulls want the rally to make a new all-time high. There is currently a 50% chance they will succeed. If the Emini can get 2 closes above 3500, the rally will probably test the September 2 all-time high
The E-mini is in the Sell Zone between 3400 and 3500. The bears will look for a reversal down this week from a lower high.
But the bull channel from the Sept. 24 low is tight and there are now 2 consecutive closes above the Sept. 16 top of the month-long trading range. Therefore, the bears will probably need a micro double top before they can get a reversal down. Consequently, traders will buy the 1st 1–2 day pullback, expecting a test back up.
Last week was a big bull bar on the weekly chart. Sometimes the following week is a big bear bar, like in early June. If today or tomorrow is a big bear day, last week’s bull breakout will probably fail. More likely, with all of the gaps up on the weekly chart this summer, there is an increased chance of a gap up today on the weekly chart.
Overnight E-mini Globex trading
The E-mini is up 24 points in the Globex session. At the end of Friday, I said that the bulls would try to create a gap up on the weekly chart this week. They probably will succeed.
When there is a big gap up on the 5-minute chart, the E-mini is far above the 20-bar EMA, which is one measure of the average price. Traders do not like to pay far above average unless they are getting something that is far above average. Many bulls will wait to see a couple big bull bars closing near their highs before buying far above the EMA.
Most often, a gap up leads to a trading range open for the 1st hour or two. That is because the 20-bar EMA is based on the most recent 20 bars. It takes that long before the EMA is based mostly on today’s early bars, putting the EMA up near those bars. Traders then see the price as being near average, and the bulls become more willing to buy.
There is a 20% chance of a strong bull or bear trend from the open. But if the E-mini has its usual trading range open, the bears will look to sell a rally to a double top or a wedge top for a test down to the EMA. They bulls want to buy a reversal up from a double bottom or wedge bottom near the EMA.
Friday’s Setups

Here are several reasonable stop entry setups from Friday. I show each buy entry with a green rectangle and each sell entry with a red rectangle. I rarely also show limit order entries and entries on the close of bars. I do not want the lines to be distracting. If they are longer, I make them dotted. But, they have to be visible, so I make the shorter ones solid. Buyers of both the Brooks Trading Course and Encyclopedia of Chart Patterns have access to a much more detailed explanation of the swing trades for each day (see Online Course/BTC Daily Setups).
My goal with these charts is to present an Always In perspective. If a trader was trying to be Always In or nearly Always In a position all day, and he was not currently in the market, these entries would be logical times for him to enter.
If the risk is too big for your account, you should wait for trades with less risk or trade an alternative market like the Micro Emini.
