The S&P 500 Futures futures formed an outside down candlestick week and September might become an outside down month. Traders will sell rallies, expecting the selloff to reach 3,000 – 3,200.
Bond futures are in the middle of a 6 month tight trading range. Traders are looking for reversals every few days.
The EUR/USD Forex market has stalled for 7 weeks at the September 2018 high. It is neutral. But because the rally on the weekly chart was climactic and a wedge, the odds slightly favor a pullback instead of a bull breakout.
30-Year Treasury Bond Futures
Bond futures monthly chart is in a 6 month tight trading range
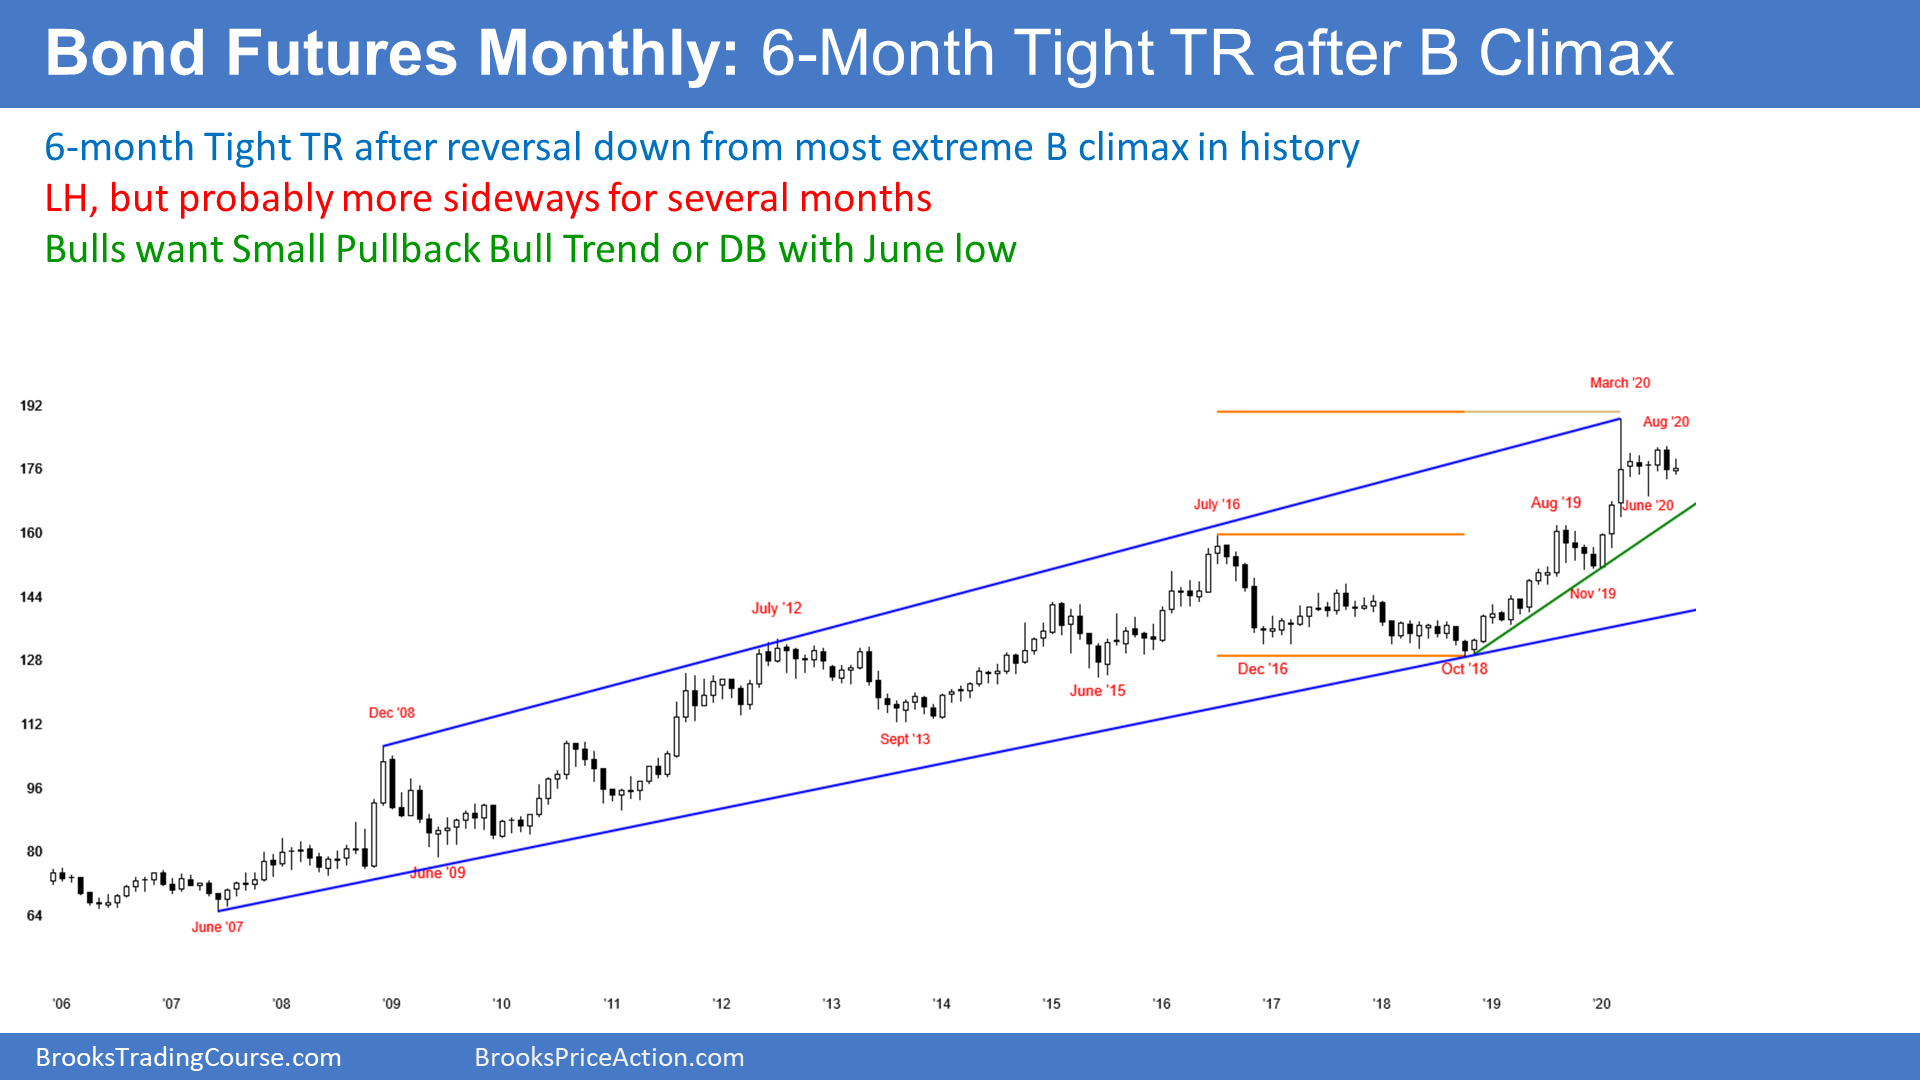
This month’s candlestick on the monthly bond futures chart has a low above last month’s low and a high below last month’s high. It is therefore an inside bar. Last month was an outside bar. There is an ioi (inside-outside-inside) pattern, which is a Breakout Mode setup. If September remains an inside bar, it will be both a buy and a sell signal bar for October. If it continues to have a bull body, traders will be more willing to buy above its high than sell below its low.
The most dramatic 3 month buy climax in history ended in March. The past 6 months have been sideways. Traders are deciding whether the small trading range is a bull flag or a pause on the way down to a bigger correction.
With the 6 bars all overlapping one another, traders see the monthly chart as neutral. There is an equal chance of a bull or bear breakout of the range.
However, most breakouts of tight trading ranges fail. Look at the failed bear breakout in June and the failed bull breakout in July. Therefore, until there is a successful breakout, the most likely path is sideways.
Bond futures daily chart has a double top and a head and shoulders bottom
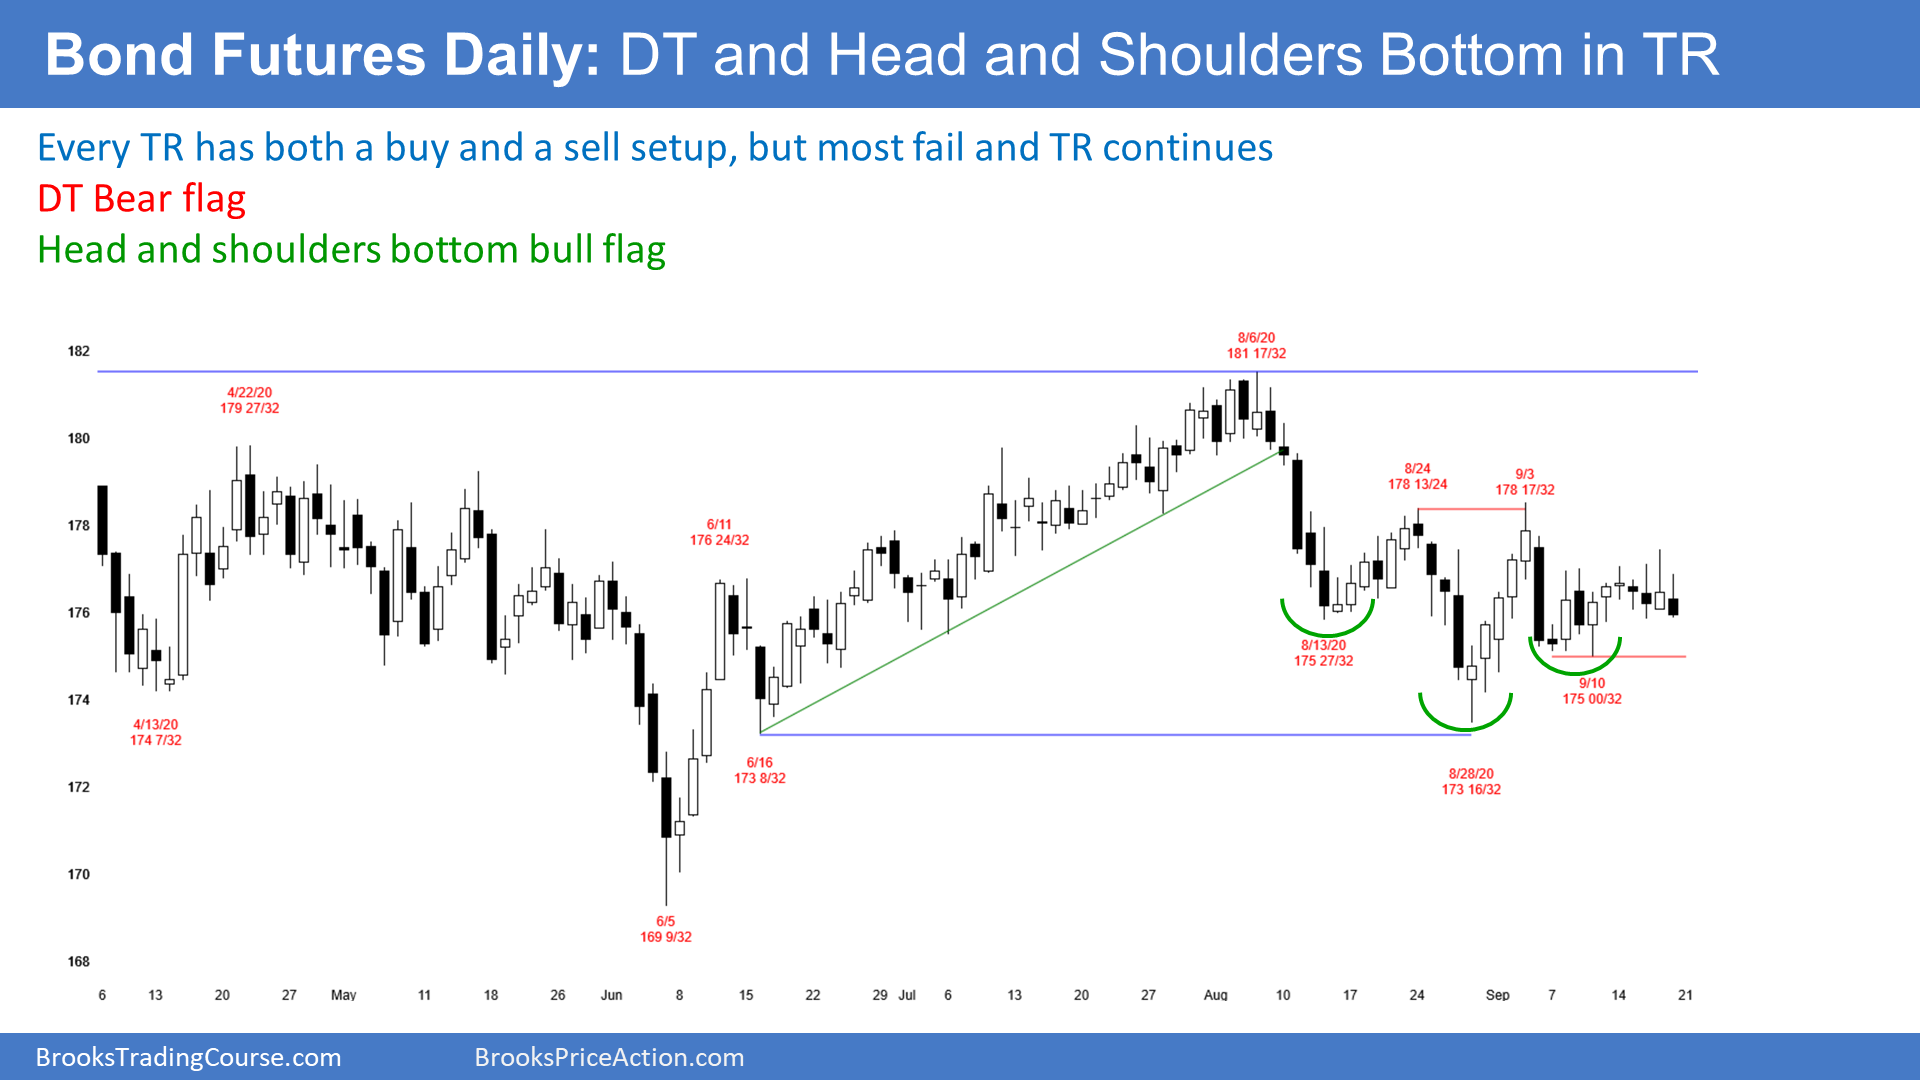
The daily bond futures chart has been sideways for a month. There are lower highs and higher lows. This is a triangle, which is a Breakout Mode pattern.
Traders know that a successful bull breakout is as likely as a successful bear breakout. Furthermore, they know that the 1st breakout of a triangle has a 50% chance of failing.
Also, once there is a successful breakout, the market tends to come back to the apex of the triangle after 10–20 bars. Why? Because both the bulls and the bears see the current price as fair. Once bonds break out, traders will wonder if the price is unfair. They usually want to see what happens after testing back to the triangle. Will the 1st breakout resume or will the bond market now break out in the opposite direction?
Until there is a breakout, traders will bet on reversals every few days. For traders to conclude that a breakout will be successful and last 2 or more weeks, they want to see confirmation. That usually means consecutive closes above or below the triangle.
EUR/USD Forex Market
EUR/USD weekly chart has a wedge rally at resistance
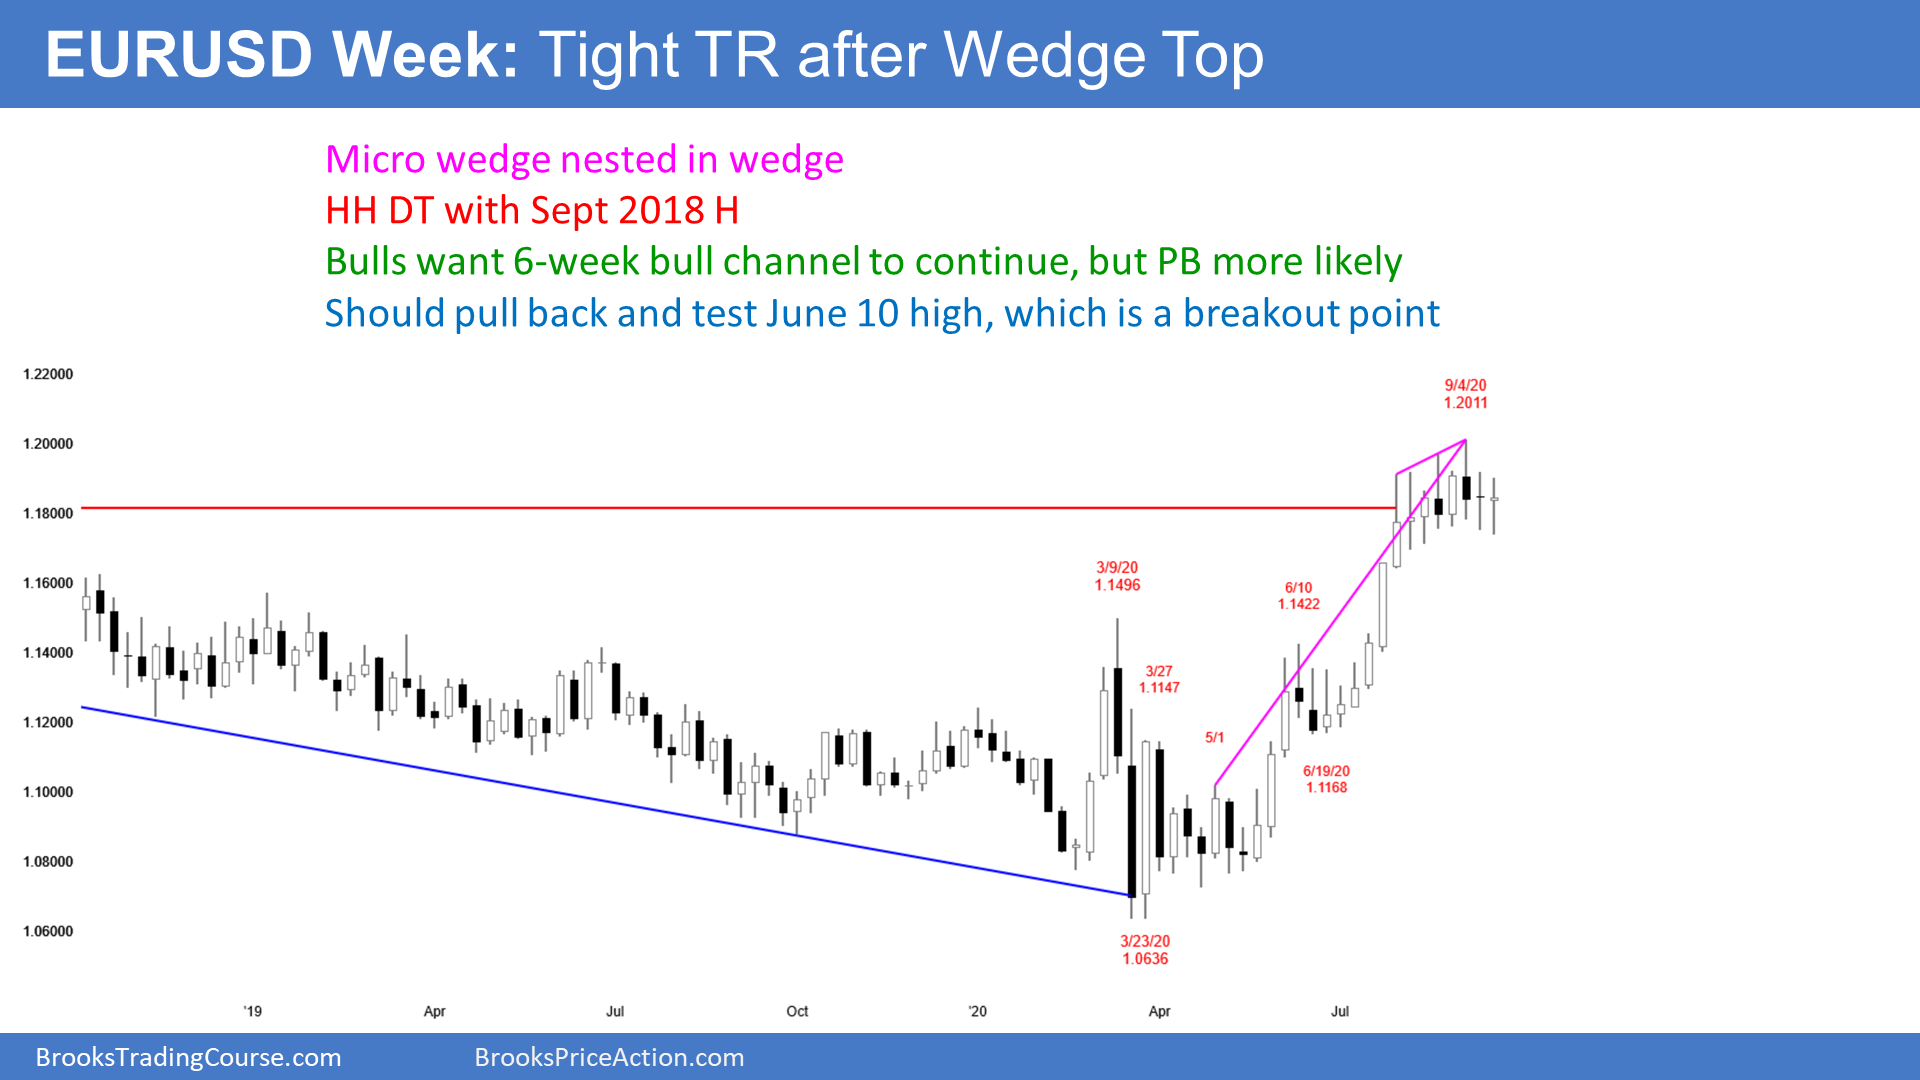
The EUR/USD weekly chart has been sideways in a tight range for 7 weeks. Each bar has largely overlapped all of the other bars. This is a Breakout Mode pattern. Traders assume that there is about a 50% chance of a successful bull or bear breakout.
The bulls see the trading range as a bull flag in a 5 month bull trend. They want the EUR/USD to break strongly above the resistance of the September 2018 high and continue up to the February 2018 high at around 1.25. That was the end of a strong, yearlong rally and the start of a 2-year bear trend.
The bears know that the rally from the March low has been exceptionally strong. But because it has had 3 clear legs up, it is a wedge bull channel. The bears know that a wedge often attracts profit-taking.
At a minimum, they are looking for a reversal down to the June 10 high, which was the breakout point of the July rally. Markets tend to come back to test breakout points. Traders want to see if the bulls will buy aggressively again at the June 10 high, like they did in July. Or, will there be more sellers than buyers there? If so, traders will expect the pullback to continue down to the next support.
That is the June 26 low. The EUR/USD went sideways there for 5 weeks. A small trading range late in a bull trend is often the Final Bull Flag. It is a magnet once the bull trend finally ends.
Less likely, there will be a reversal down from the wedge that retraces the entire rally and possibly breaks below the March low.
What Is Most Likely Over The Next Several Weeks?
I said that the probability is about the same for the bulls and the bears. However, a wedge rally to a double top (with the September 2018) high is a reliable pattern. It is probably more important than the momentum up from the March low. Therefore, the bear case and a test of the June 10 high is slightly more likely than another leg up to the February 2018 high.
EUR/USD daily chart has a head and shoulders top and a triangle bull flag
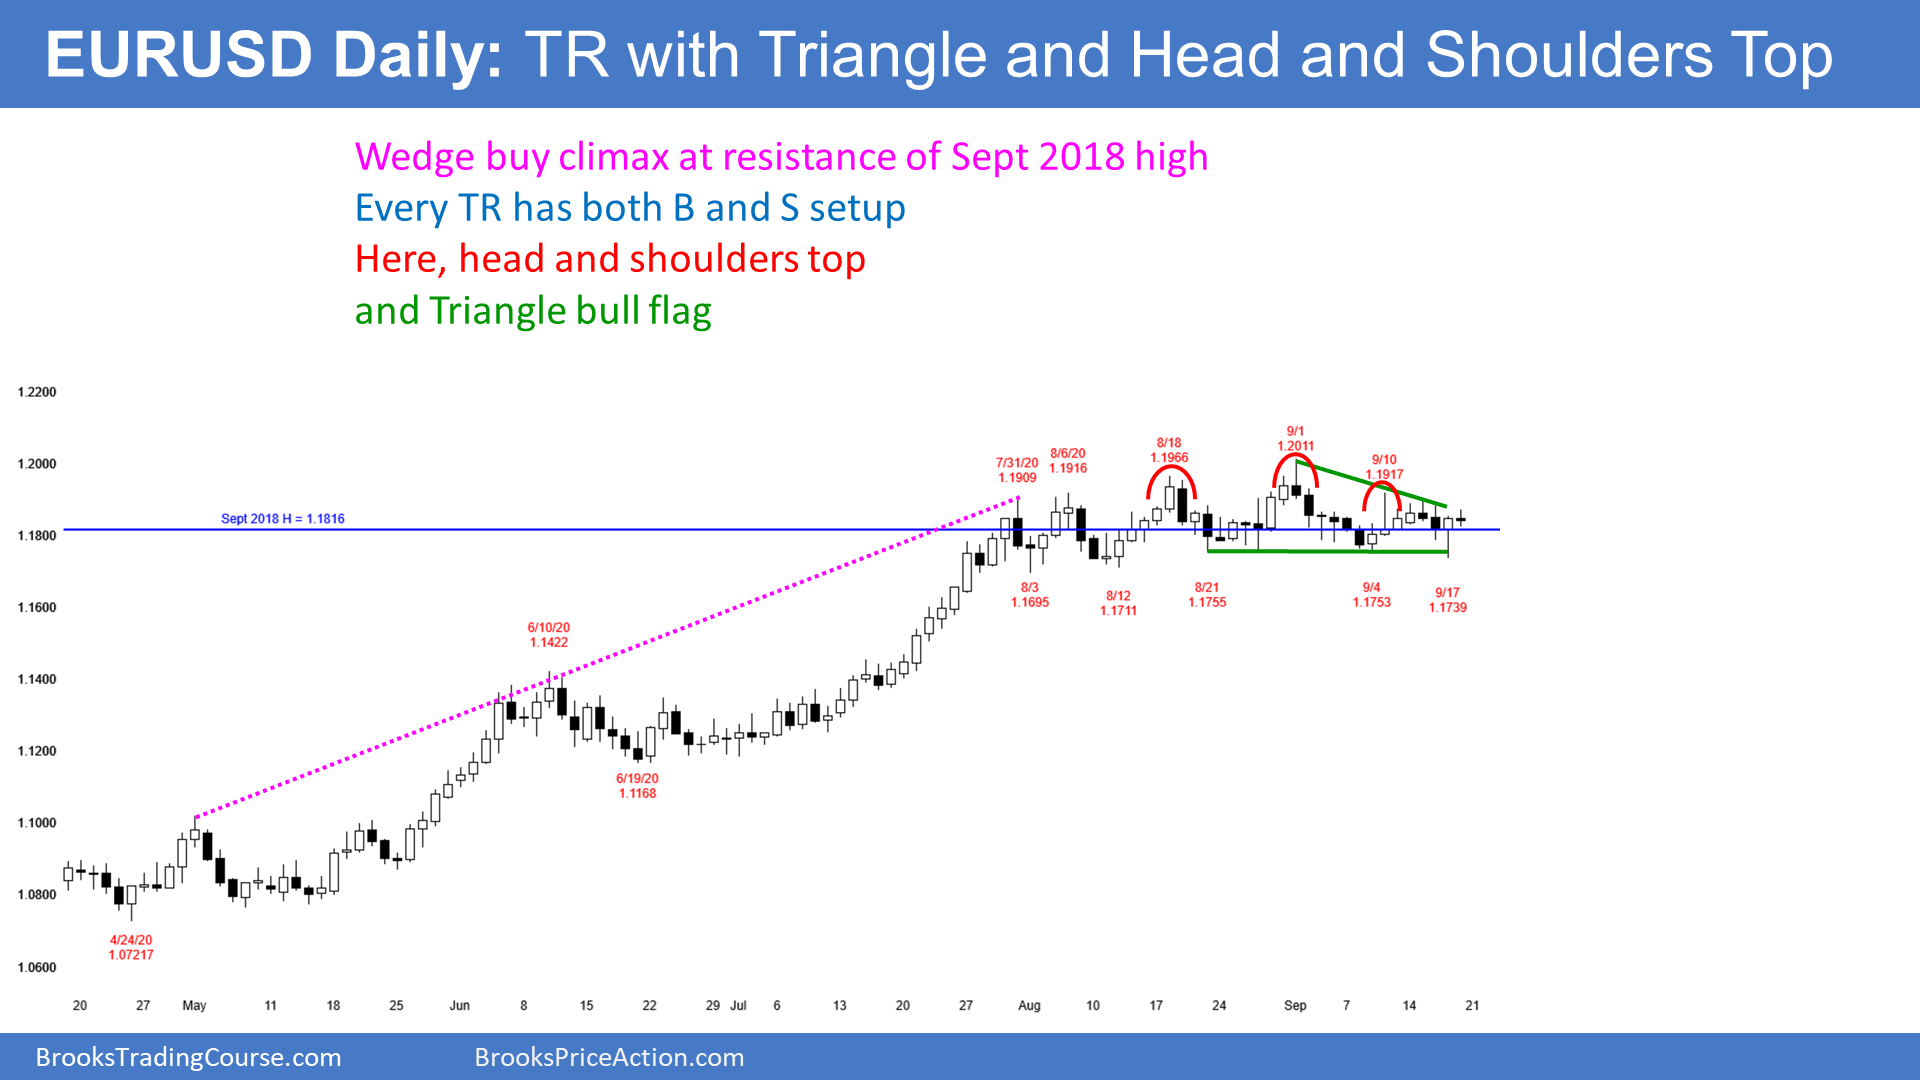
The EUR/USD daily chart has been in a tight trading range for 7 weeks. There have been many small legs up and down and minor breakouts up and down. Traders will continue to look for reversals every week or so until there is a clear, strong breakout in either direction.
The bulls got a reversal up on Thursday after a failed breakout below the Sept. 9 low. That low is the neckline of a head and shoulders top with the highs of Aug. 18, Sept. 1, and Sept. 10. Traders expected the breakout to fail because most breakouts fail. Even a perfect head and shoulders top only has a 40% chance of actually leading to a reversal from a bull trend to a bear trend.
Will this reversal up lead to a successful breakout above the trading range? Probably not because, as I said, most breakouts fail. Traders will look for reversals and take quick profits as long as the trading range continues. There is nothing to indicate that a breakout is imminent.
S&P500 Emini Futures
Monthly Emini chart could have an outside down candlestick in September
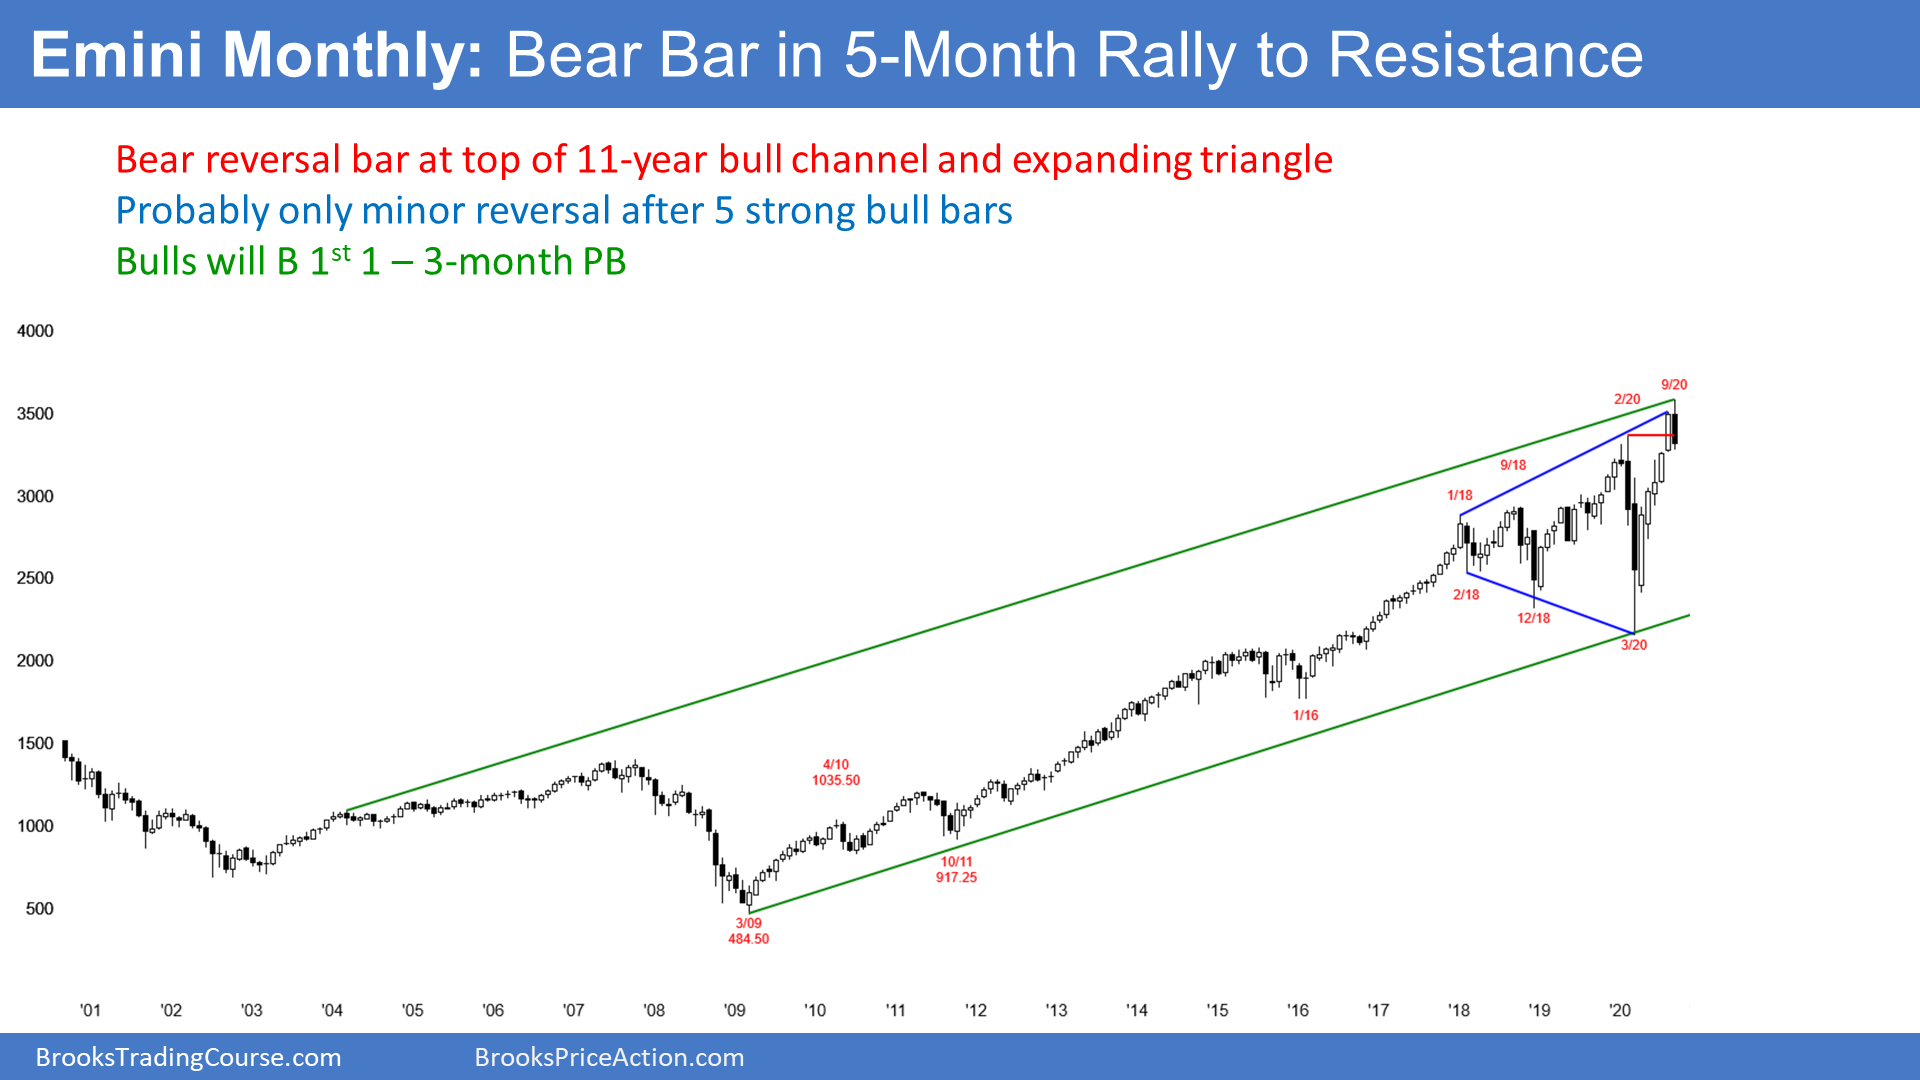
The monthly S&P 500 Emini futures chart so far has a bear body in September. There are 8 trading days remaining in the month and the candlestick could look very different on Sept. 30. It could even have a bull body, but that is unlikely.
If September trades below the August low, it would be an outside down month. That would increase the chance of at least slightly lower prices in October. That would probably also close the gap below the August low.
If September does not go outside down, but closes on the low of the month, September would be a sell signal bar for October. Traders would expect a minor reversal down for a month or two.
Minor Reversal Down Likely
The Emini had a dramatic 5-month rally through August. It was strong enough to make traders confident that the current reversal down will be minor. It could last a couple months, but there is only a 30% chance of a strong reversal down to the March low without first forming a trading range.
Trading ranges have legs that go down and legs that go up. Trader believe that the developing selloff will more likely be a leg in what will become a trading range or bull flag than the start of a bear trend. This is true even if the selloff retraces half of the 5-month rally. Traders would need to see 3 consecutive big bear bars closing on their lows before they would believe that there is a reasonable chance of a trend reversal.
3 Years Into A Decade Of Sideways Trading
How high will the bull trend go? Since 2017, I have been saying that the stock market would probably be sideways for a decade between approximately 2000 and 4000. This is because the 2017 rally was the most extreme buy climax in the history of the stock market on the daily, weekly, and monthly charts.
The bulls are hoping that the past 3 years were enough of a pause for the 10 year bull trend to resume. I don’t think so. With the most extreme buy climax in history, the market will probably have to correct like it did in the late 1960’s and after 2000. Both of those corrections lasted about a decade. And both had a least a couple 40% selloffs. In 2009, there was a 58% selloff.
A Decade-Long Trading Range Is Bad For Investors But Good For Traders
While a trading range for 10 years is bad for investors who buy and hold, it is great for traders. If a trader waits for a 20–30% correction in the Emini, a stock that he wants to buy that was 100 might now be 60.
A couple years later, the Emini is back at the high at the top of the developing trading range, and his stock is testing its old high at 100. That $40 increase in his stock is a 67% profit in two years.
While this sounds easy, it is virtually impossible to consistently do it. However, if a trader does not catch the exact bottom and top, and buys at 70 and sells 2 years later at 90, he still made 28%. Good for traders.
Weekly S&P 500 Emini futures chart working lower after buy climax
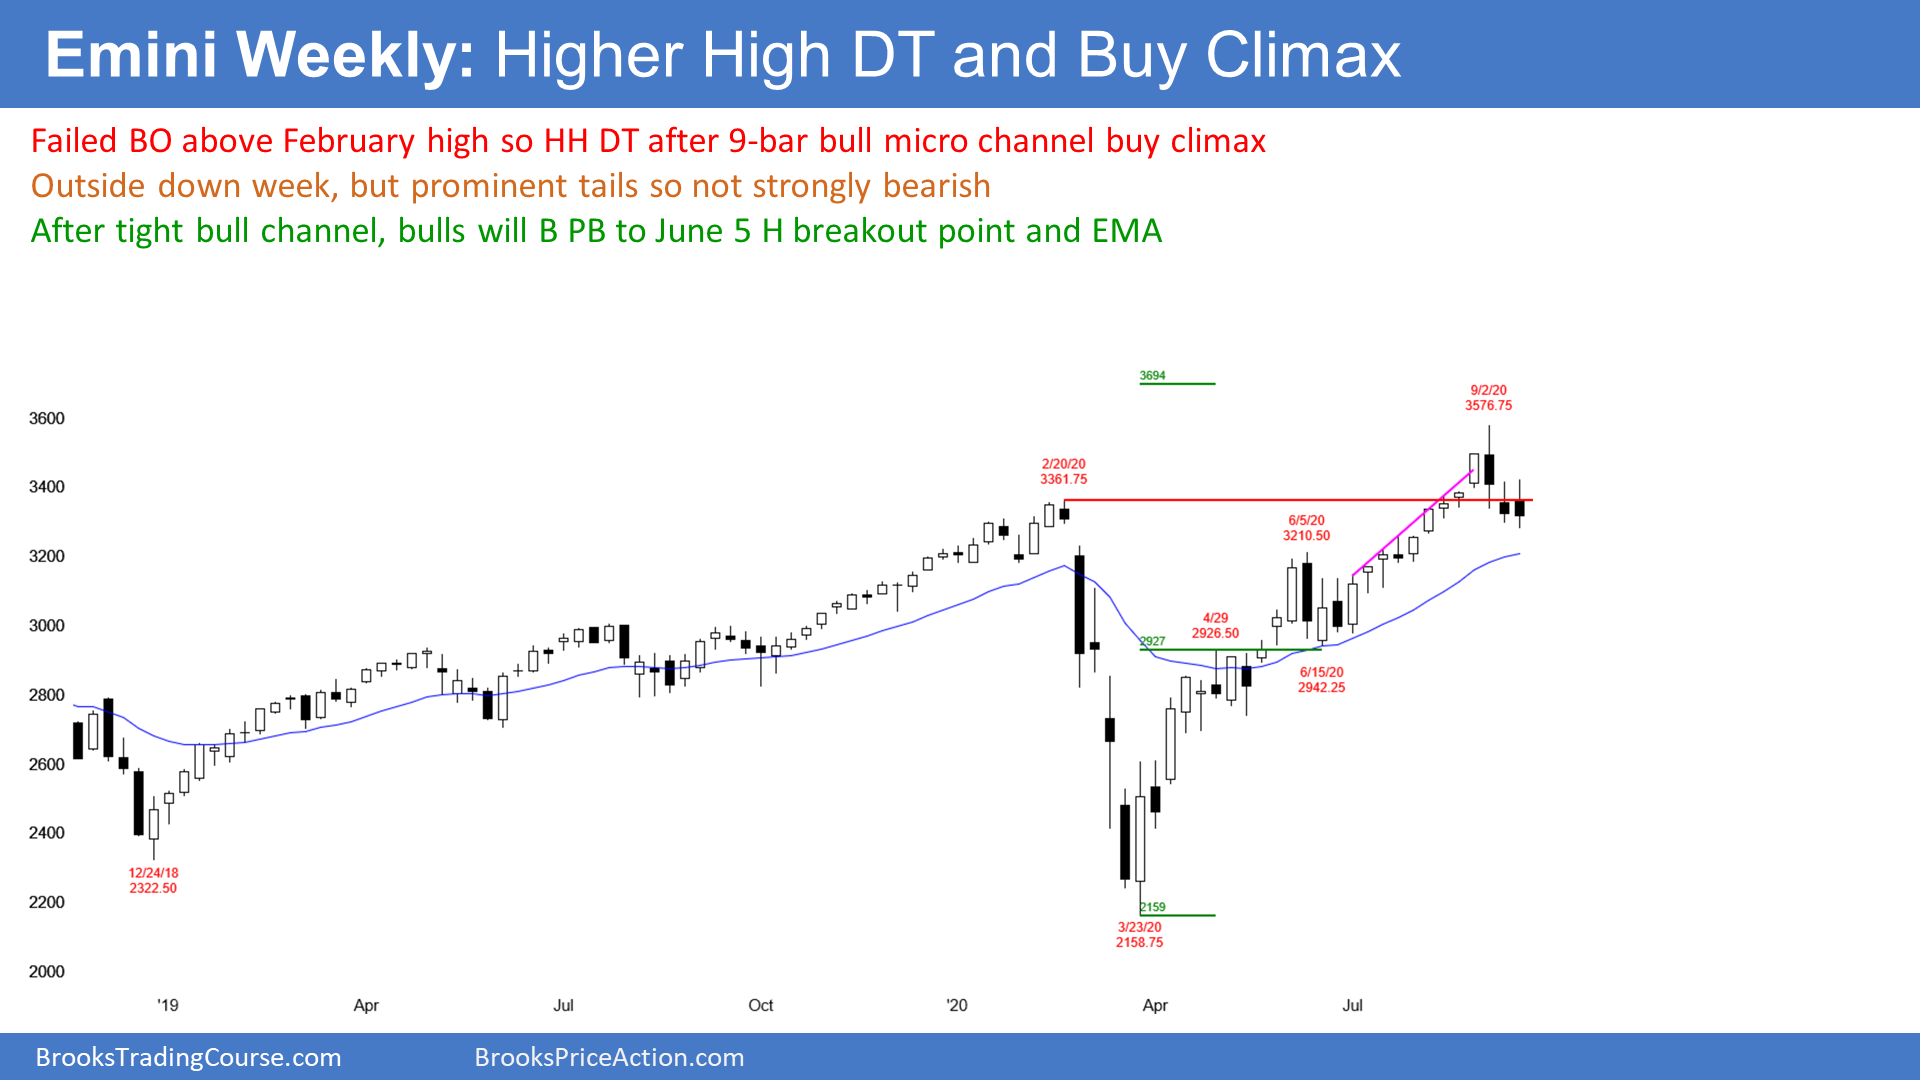
The weekly S&P 500 Emini futures chart reversed down 3 weeks ago from the top of a 3 year expanding triangle. The reversal came with an outside down bar. However, that bar had a big tail below and a close above the low of the prior week. Additionally, it was in a 9-bar bull micro channel. The reversal down will therefore likely be minor. A trading range is more likely than a bear trend. That is still true.
Last week traded below the low of that outside down bar. That triggered the weekly sell signal. But instead of a big bear bar closing on its low, the candlestick had a small bear body and prominent tails. That is not how strong bear trends typically begin.
This week traded above last week’s high and then below its low. This is therefore another outside down week. But it closed above last week’s low and it has a prominent tail below.
While traders expect lower prices, all 3 bear bars have prominent tails. That reduces the bearishness of the reversal down. It increases the chance of a 1–2 week bounce before the pullback is done.
Bad High 1 Bull Flag Buy Signal
Because last week was a pullback in a strong bull trend, it was a High 1 bull flag buy signal bar for this week. But it had a bear body and it followed a bear outside down bar in a buy climax at resistance. That is why I wrote last week that there would probably be more sellers that buyers above the high of the bar.
This week traded above last week’s high and therefore triggered the weekly buy signal. But like I said was likely, there were more sellers than buyers above the bar, and this week quickly reversed down.
I have been saying for several months that the reversal up in March was so strong that traders would buy the 1st pullback. But the pullback could continue for several more weeks. Traders are waiting to buy a credible bottom. However, they know that the Emini might have to fall to below 3000 before it resumes back up.
Cup And Handle Buy Setup Likely Will Form
I have said that a cup and handle buy setup should form within the next couple months. When there is a sell climax, like in March, and then a strong reversal up, traders expect at least a small 2nd leg sideways to up. That means they will buy that 1st pullback.
The March selloff and the 5 month reversal up is the cup. The developing pullback is the handle. The handle can last 20 or more bars and can retrace half of the rally. It could also be brief and shallow. It is too early to tell what it will look like. However, we do know that the bulls are looking to buy the pullback.
After the sharp selloff from an extreme buy climax to resistance, the pullback should have at least a couple small legs down. It could last a couple months. But once the selling dries up and the market goes sideways for a few weeks, the bulls will look to buy above a bull bar closing near its high. They expect a test of the September 2nd all-time high.
Daily S&P 500 Emini futures selling off to 3000–3200
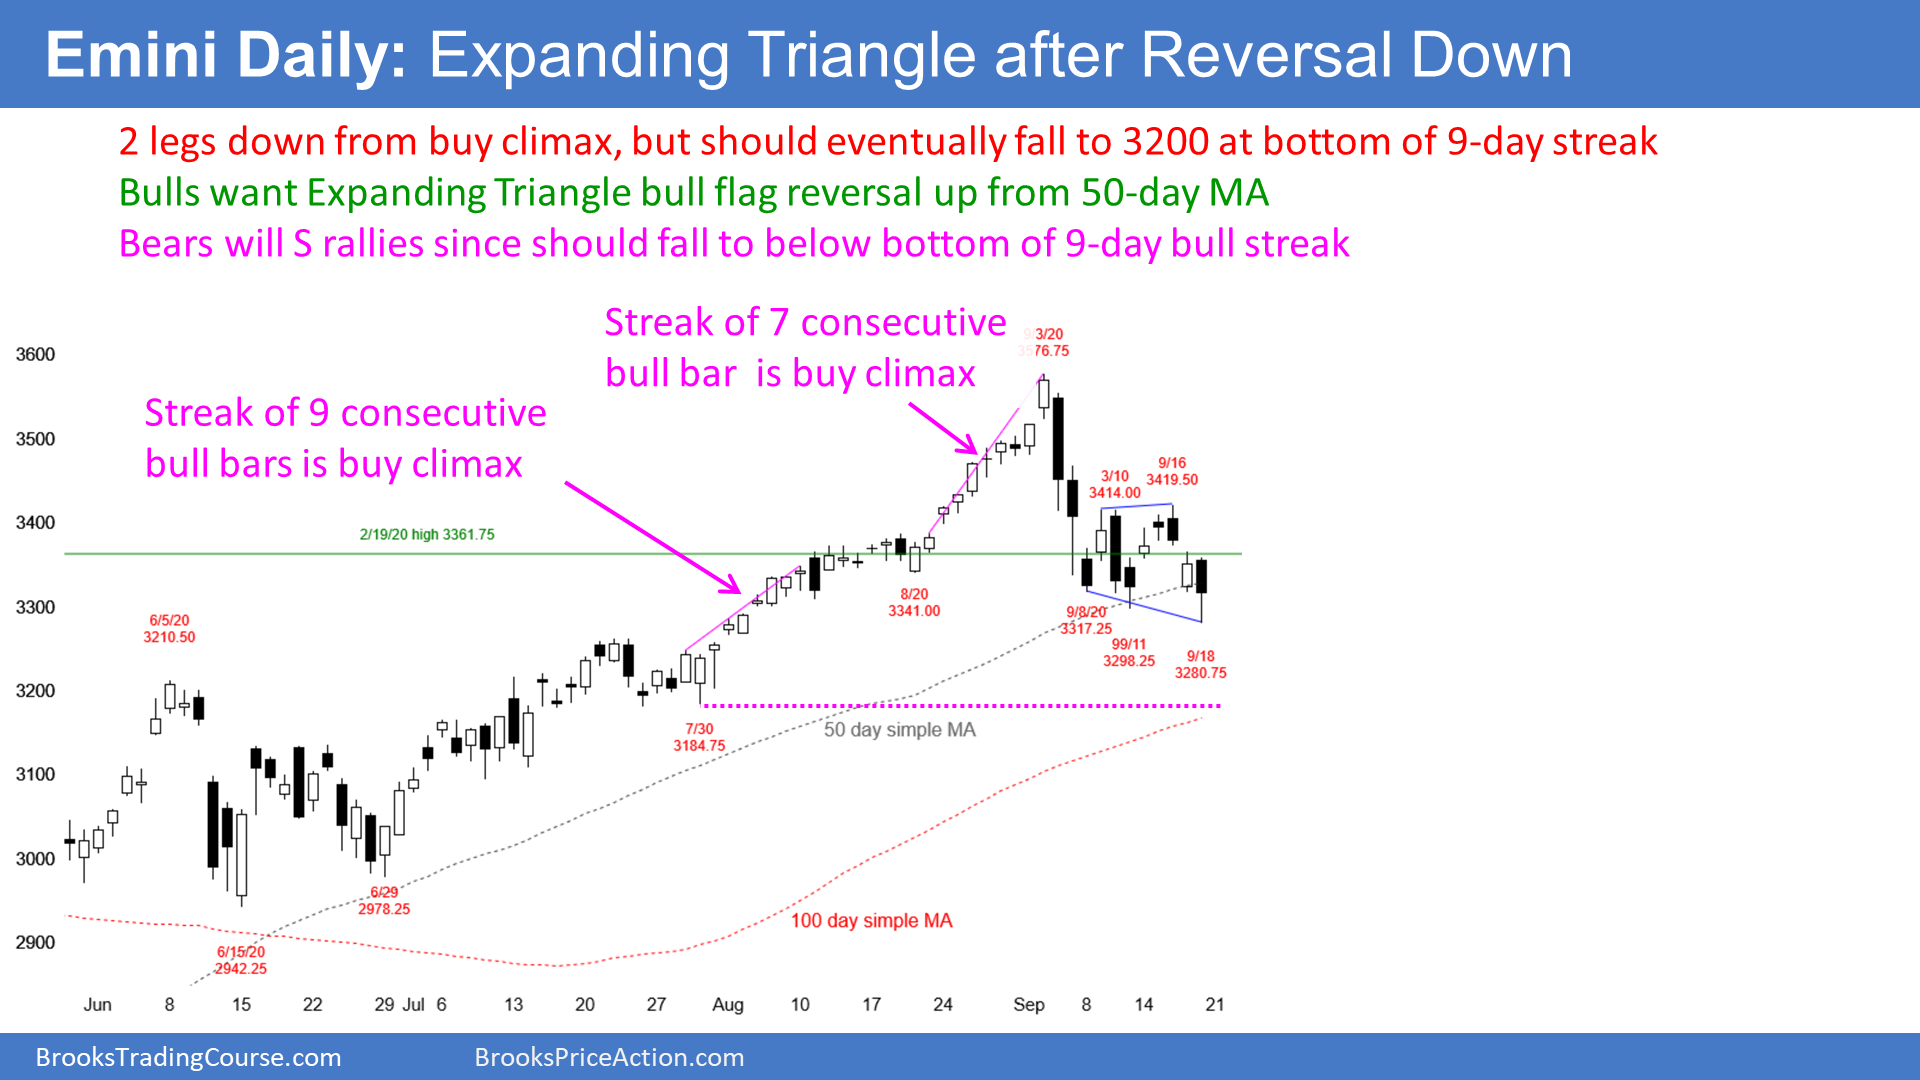
The daily S&P 500 Emini futures chart has been sideways for 2 weeks after a sharp reversal down from an extreme buy climax. On Friday, the Emini broke below the range. But it closed back in the range and therefore there is no convincing breakout yet.
There are many ways to decide that a market is in a buy climax. The daily chart has a fairly reliable one. There were 9 consecutive bull trend bars through August 10 and then a second streak of 7 bars through Aug. 28.
Streaks like this usually result in profit-taking and therefore are buy climaxes. For example, the last time there were 9 consecutive bull days was in January 2018. The Emini rallied for a couple more weeks and then reversed down to far below the bottom of the streak.
The current selloff has already dropped below the bottom of the August 28 streak. Traders should expect it to get down to below the bottom of the Aug. 10 streak before there is a new high. The bottom of that streak was the July 20 low of 3184.75, or about 3200. That low is also just below last year’s close. If the Emini gets there, it will have erased all of 2020’s gains.
June Trading Range Might Be A Final Bull Flag
There was a trading range in June that came fairly late in the rally from the March low. It is therefore a good candidate for a Final Bull Flag. Its low is therefore a magnet. The June 15 low was 2942.25. That is why I have been saying that it is reasonable to think that the selloff could continue down to 3000.
Also, that is where the extremely tight, 2-month bull channel began. A tight bull channel is a buy climax. Once there is a reversal down from a buy climax, the start of the buy climax is a downside target. This is another reason why the Emini could fall to 3000.
Numbers Can Be Psychological Magnets
Markets often get drawn to certain numbers, like the 3000 Big Round Number. That is 18% down from the high. Eighteen percent is close to 20%. Twenty percent is a psychological magnet because if a market falls 20%, it is no longer just in a correction. It is now in a bear market.
Support and resistance are magnets. Like a magnet, the pull is much greater when you get very close. Therefore, if the Emini falls 18%, it will probably continue down to 20%, which is 2861.
That is just below the April 29 high, which was the breakout point for the May rally. Breakout points are also magnets.
Where Will The Emini Go Next?
At the moment, before there is a new high, there is a 60% chance that the Emini will fall to 3200, a 50% chance it will fall to 3000, and a 40% chance it will fall 20% to 2861.
What about the other direction? There is a 40% chance that the Emini will rally to a new high before falling to 3200. However, there is close to a 50% chance that it will reverse up from the bottom of bottom of the 2-week trading range next week as the bulls try to prevent a strong bear close for September.
Remember, the Emini has been in a trading range for 2 weeks. Every trading range has both a reasonable buy and sell setup. In this case, the bears have a double top. The bulls have a possible expanding triangle bull flag, but there is no buy signal bar yet.
Trading ranges are neutral. This one is slightly more bearish because it formed after a reversal down from an extreme buy climax and it has not yet reached important magnets as well.
However, just because you know the destination does not mean you know the path. If you take an airport shuttle from Times Square to JFK, you know you will end up at JFK, but you don’t know how many other stops the van will make before you get there.
A bear breakout is slightly more likely than a bull breakout, but the selloff has not been particularly strong after the 1st 2 big bear days. The Emini might have to go higher to find more aggressive sellers.
But even if it breaks strongly above the 2 week range, it will probably form a lower high at around 3500 and then resume down to the targets below. Therefore, a breakout above the trading range will likely fail to lead to a new high.
The election and current political environment creates so much negativity that it might be impossible for the stock market to rally much until after the election results are final. Therefore, the Emini will probably be in a trading range through the end of the year.
