Pre-Open Market Analysis
The Emini gapped up on Friday. This was a gap up on the monthly chart as well as on the daily chart. Gaps on the monthly chart rarely stay open. Consequently, there will probably be a pullback below Thursday’s high soon. But “soon” could be 5 – 10 bars, which is many months on the monthly chart.
October was an outside up bar in a bull trend on the monthly chart. Friday triggered the buy signal by going above the October high. Traders therefore expect higher prices over the next month or two.
What about today? Friday was a bull bar on the daily chart and it broke above the 21 month trading range. The bulls need follow-through buying to convince traders that the breakout will succeed. They should get it this week. However, when the Emini breaks above major resistance, it often soon goes sideways for a day or two before continuing up.
The bears want the breakout above the July high to fail. But they will need a good sell signal bar on the daily chart before traders will consider that possibility. That means the bears need one or more days closing near their lows.
Even if they get it, the trend up is strong on all time frames. Traders will buy the 1st reversal down. There is not much downside risk over the next few weeks.
Overnight Emini Globex Trading
The Emini is up 18 points in the Globex session. It will therefore probably gap up on the day session. With last week’s gap up on the monthly chart and the strong breakout on the weekly chart, the Emini should work higher for a month or two. When there is a strong breakout, there is an increased chance of bull days closing near their highs on the daily chart. As a result, traders expect either a bull trend day or a late reversal up with today closing near its high.A bull breakout is a buy climax. Profit taking can begin at any time. Day traders therefore will be ready for an occasional bear trend day. But with the higher time frame charts in a bull breakout, even if there is a 3 hour selloff on the 5 minute chart, there is an increased chance of a late rally. The odds are against a strong bear trend day.
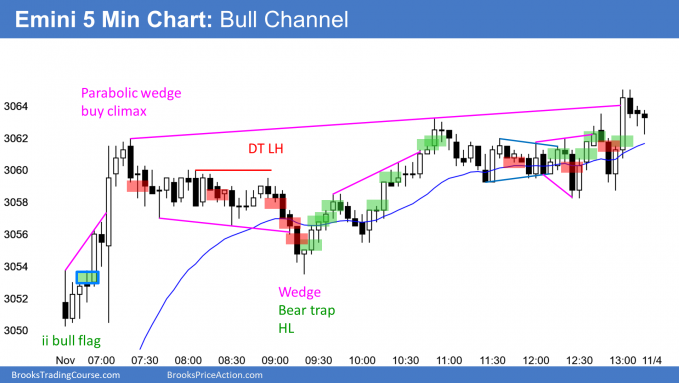
Friday’s Setups

Here are several reasonable stop entry setups from Friday. I show each buy entry with a green rectangle and each sell entry with a red rectangle. I rarely also show limit order entries and entries on the close of bars. Buyers of the Brooks Trading Course and Encyclopedia of Chart Patterns have access to a much more detailed explanation of the swing trades for each day.
My goal with these charts is to present an Always In perspective. If a trader was trying to be Always In or nearly Always In a position all day, and he was not currently in the market, these entries would be logical times for him to enter.
