Pre-Open Market Analysis
I said on Monday that Tuesday was likely to trade below Monday’s low, and it did. This is because there has been a pullback every few days in the 5-week rally. With Monday being the 3rd day up and having a bear body, it was a good candidate to begin a pullback.
Will Tuesday be a 1-day pullback? The 2 most recent pullbacks lasted 2 days. Also, yesterday closed near its low. Therefore, today will probably trade below yesterday’s low and be the 2nd day in the pullback. If today has a bear body, there would then be 3 consecutive bear days on the daily chart. The bears will then begin to sell above the bear bars, betting that the Small Pullback Bull Trend might be evolving into a tight trading range.
Since yesterday was a pullback, it is a buy signal bar for today. But it had a bear body and it was the 2nd consecutive bear day. That is a weak buy setup. There will probably be sellers above and around 3100.
Many bulls want the rally to reach the 3100 Big Round Number before they take some profits. Since the rally is climactic and there will be profit-taking around 3100, the rally will likely begin to have more sideways trading this week.
After 4 consecutive bull bars on the weekly chart, the downside over the next couple weeks is small. But 4 weeks is a lot. There probably will be a 1 – 2 week pullback at some point in November.
Overnight Emini Globex Trading
The Emini is up 4 points in the Globex session. It will therefore probably open in the middle of yesterday’s range.The Emini has had 2 trading range days. While today might be a 3rd, the 2 days are probably forming a bull flag. Also, the Emini will probably test 3100 before there is a test down to below the October high.But 2 sideways days late in a bull trend usually becomes the Final Bull Flag. There will probably be a deeper 1 – 2 week pullback at some point in November.Remember, gaps are rare on the monthly chart. Traders should expect an attempt to close this month’s gap up this month. Therefore, if the Emini tests 3100 within the next week, there will then probably be at least a 50 point selloff within a couple weeks.
Yesterday’s Setups

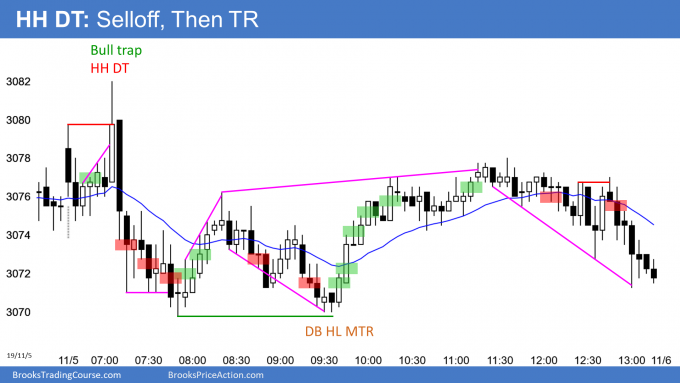
Here are several reasonable stop entry setups from yesterday. I show each buy entry with a green rectangle and each sell entry with a red rectangle. I rarely also show limit order entries and entries on the close of bars. Buyers of the Brooks Trading Course and Encyclopedia of Chart Patterns have access to a much more detailed explanation of the swing trades for each day.
My goal with these charts is to present an Always In perspective. If a trader was trying to be Always In or nearly Always In a position all day, and he was not currently in the market, these entries would be logical times for him to enter.
