Pre-Open Market Analysis
The Emini sold off early yesterday on China trade news, but the strong bull trends on the daily and weekly charts were more important. The day reversed up and it is a buy signal bar for today on the daily chart.
Traders expect a test of 3100. However, the rally is climactic. Therefore there will probably be a 1 – 2 week pullback soon. It might be underway already, but the Emini will more likely test 3100 first.
Since a gap up on the monthly chart is rare, the pullback will probably fall below the October high and close the gap. However, the bull trend is strong. Traders should expect higher prices after the Emini closes the gap.
Overnight Emini Globex Trading
I said yesterday that yesterday would have a bull body on the daily chart and become a High 1 buy signal bar for today. I also said that there would probably be a test of 3100 before there is a 2-week pullback. The Emini is up 12 points in the Globex session. It will therefore probably gap above yesterday’s high. That will trigger the buy signal on the daily chart.A big gap up increases the chance of a trend day. If there is a trend, up is more likely than down.With so much trading range price action over the past few weeks, today will probably not form a strong trend. Traders should expect a lot of sideways trading even if today is a trend day.However, the daily chart is in a buy climax and 3100 is a psychological barrier. Consequently, traders should expect a test down to the October high to begin within a week. The rally might go 20 points above 3000 before the pullback begins. But the probability is now shifting in favor of some profit taking after 4 strong weeks up.A reasonable target would be a test of the October high of 3049. If there is a pullback, it will probably fall below that high and close the gap on the monthly chart. Traders will buy the pullback.The yearlong rally and the rally of the past month make higher prices likely for at least the remainder of the year.
Yesterday’s Setups

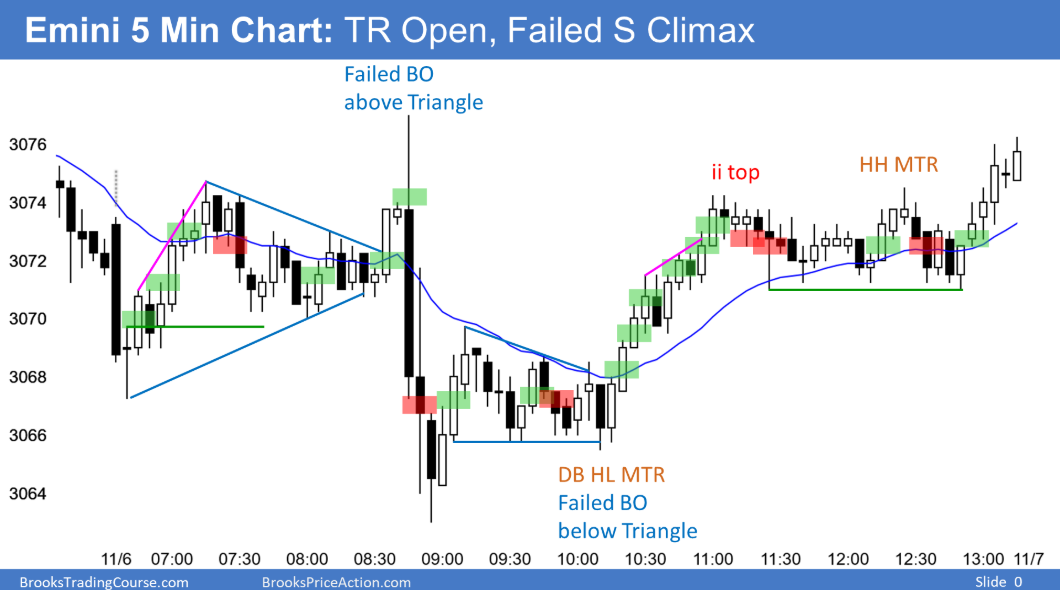
Here are several reasonable stop entry setups from yesterday. I show each buy entry with a green rectangle and each sell entry with a red rectangle. I rarely also show limit order entries and entries on the close of bars. Buyers of the Brooks Trading Course and Encyclopedia of Chart Patterns have access to a much more detailed explanation of the swing trades for each day.
My goal with these charts is to present an Always In perspective. If a trader was trying to be Always In or nearly Always In a position all day, and he was not currently in the market, these entries would be logical times for him to enter.
