Investing.com’s stocks of the week
Pre-Open market analysis
The Emini had a dramatic rally on Thursday morning on news of possibly no new China tariffs on December 15. It has been sideways since. Friday was a doji bar on the daily chart and therefore it is a low probability sell signal bar for today. The bears want Thursday’s breakout to fail. A reversal down would be from an expanding triangle top over the past month. However, any reversal down will probably be minor because the bull trend on the weekly chart is so strong.
The bulls see Friday as a pause after a climactic 2 week rally. They have had a great year. The year opened on its low and the bull trend has been very strong. They will try to get the year to close on its high. That will limit the downside for the rest of the month.
I have been saying for months that the Emini will work higher. That is still true, but Thursday was climactic. Therefore, there might be a pullback for a day or two this week.
Overnight Emini Globex trading
The Emini is up 14 points in the Globex session. It might gap up on the daily and weekly charts to a new high. Traders see the 3200 Big Round Number as a magnet above. The Emini will probably get there this week and maybe today. This is especially true with the strong bull trend on the weekly chart and the desire of the bulls to have the year close on its high.
A small gap up usually closes early in the day. However, with the strong momentum up on the daily and weekly charts, the odds would favor a pullback instead of a reversal. Unless the bears get several bear bars closing near their lows on the open, traders will look to buy any early selloff.
The Emini is in a buy climax and at resistance on the daily chart. That increases the chance of a trend day up or down. But most of the days over the past few weeks spent a lot of time going sideways, even though the Emini has been going up. Unless there is a strong breakout up or down early today, traders will again expect a lot of trading range price action.
Friday’s setups

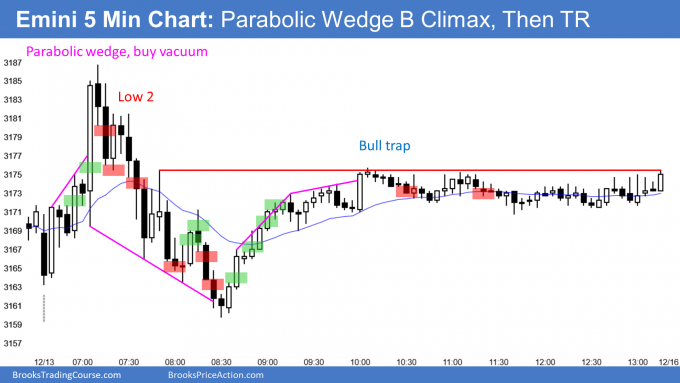
Here are several reasonable stop entry setups from Friday. I show each buy entry with a green rectangle and each sell entry with a red rectangle. I rarely also show limit order entries and entries on the close of bars. Buyers of the Brooks Trading Course and Encyclopedia of Chart Patterns have access to a much more detailed explanation of the swing trades for each day.
My goal with these charts is to present an Always In perspective. If a trader was trying to be Always In or nearly Always In a position all day, and he was not currently in the market, these entries would be logical times for him to enter.
