Pre-Open Market Analysis
There has been only one instance of more than 9 consecutive bull bars on the weekly chart in the past 20 years. This is now the 10th week in the streak. Consequently, this week will probably close below the open of the week, which was yesterday’s open.
Yesterday created a gap up on the weekly chart. If the bulls take profits this week, their selling will probably close the gap above last week’s high. In addition, there would finally be a bear body on the weekly chart. If so, the Emini will probably pull back for 2 – 3 weeks and 50 – 100 points.
Sell Signal On The Daily Chart
Yesterday was the best bear bar in 2 months. In addition, the daily chart is in a parabolic wedge buy climax at major resistance. The reversal is taking place just above 2800. The bulls have failed many times at and above 2800 for more than a year. Also, yesterday was a failed breakout above the December stock market crash high.
Consequently, if today forms a buy signal bar, the bears will be more willing to sell above its high and above yesterday’s high. The odds are that a 2 – 3 week pullback is beginning, even if there is a brief push above yesterday’s high.
This is a logical area for the bulls to begin to take some profits. If they do, they usually will wait about 10 bars before buying again. Therefore, there will probably be a 2 – 3 week pullback beginning this week or next week.
Can the bears get a strong selloff? Probably not. When a bull channel is tight, the 1st reversal down is typically minor. However, if the bears can create a trading range for a couple of weeks, they will have a double top. That would have a better chance of a bigger pullback.
Overnight Emini Globex Trading
The Emini is down 6 points in the Globex session. The daily chart is still in a Small Pullback Bull Trend. As a result, yesterday’s selloff will probably lead to another 1 – 2 day pullback. The bulls will then try to resume the breakout above 2800 and the triple top.
But, the odds are that the daily chart is transitioning into a pullback for 2 – 3 weeks. Therefore, the bears will be more willing to sell rallies and above prior highs.
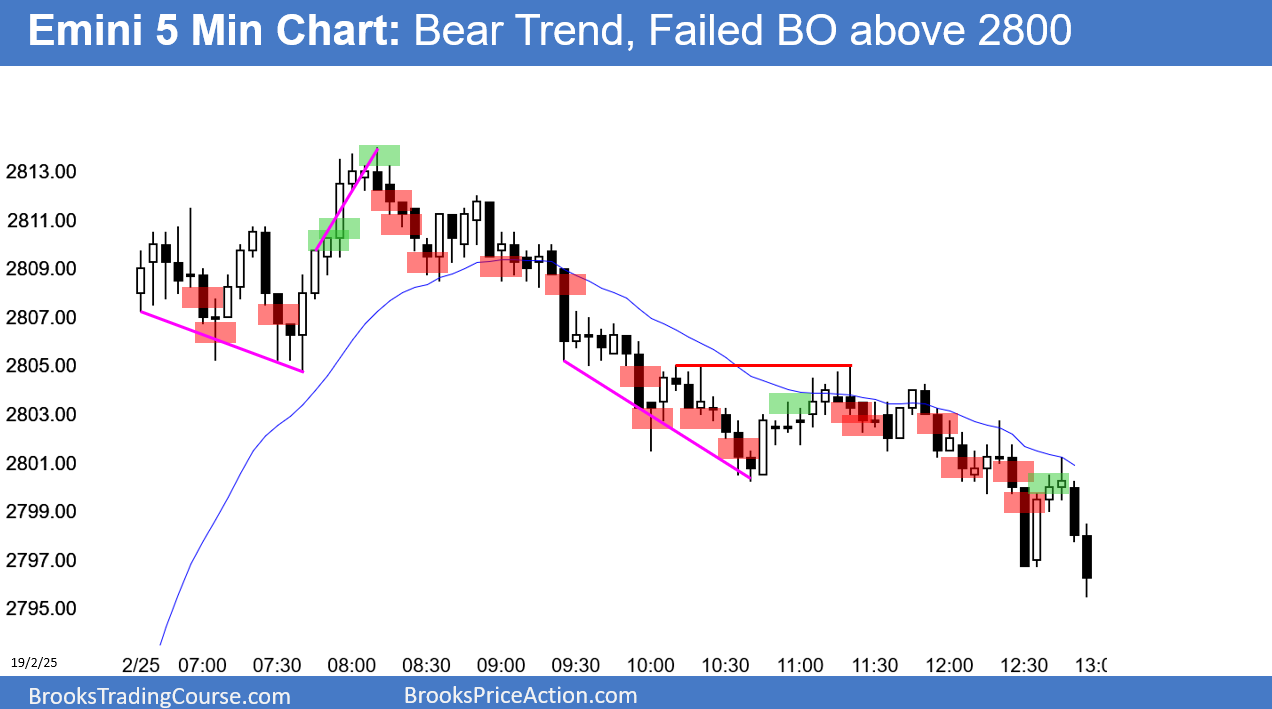
On the 5-minute chart, yesterday was a bear channel. A bear channel is a bull flag. There is a 75% chance of a breakout above the bear channel today or tomorrow. But, the daily chart is losing its bullishness. Consequently, a rally today will probably lead to a trading range and not a strong bull trend.
Can yesterday’s selloff continue today? Yes, but the selloff was weak. Until the bears create a strong reversal down on the 5 minute chart, the best the bears will probably get is a trading range over the next week. Since yesterday looked like a bear leg in a trading range, today will probably have at least one bull leg lasting 2 – 3 hours.
Yesterday’s Setups

Here are several reasonable stop entry setups from yesterday. I show each buy entry with a green rectangle and each sell entry with a red rectangle. I rarely also show limit order entries and entries on the close of bars. My goal with these charts is to present an Always In perspective. If a trader was trying to be always In or nearly always In a position all day, and he was not currently in the market, these entries would be logical times for him to enter.
