Pre-Open market analysis
The Emini gapped above the month-long trading range on Thursday. But Thursday and Friday were trading range days. The bulls did not get strong follow-through buying and the bears do not yet have a reversal down.There is still a 50% chance that the breakout will reverse down before the Emini rallies to a new high. There is at least a 60% chance of a pullback below the top of the ledge within a couple of weeks.If the Emini gaps down any day this week, there will be an island top with Thursday’s gap up. Island tops are minor reversal patterns. However, the context is good for the bears. If there is a gap down, there is an increased chance of a selloff that could last several weeks.Traders know that the Emini could continue up or reverse down. They are waiting for more information. Until there is follow-through buying or a strong reversal down, the Emini will remain neutral on the daily chart.
Overnight Emini Globex trading
The Emini is up 10 points in the Globex session. The bulls want today to close above the 3,000 Big Round Number. That is psychological resistance. If they succeed, the Emini will then probably test the all-time high this week.
However, as strong as the September rally has been, there is still only a 50% chance that this rally will lead to a strong break above the old high. Until there is a breakout, there is no breakout.
The past 2 days were trading range days in a 2 week bull trend. Markets tend to continue what they have been doing. Consequently, there is an increased chance of more trading range price action today. This is true even if the bulls break above the 3,000 resistance level. It is common for a market to break through support or resistance and then oscillate around that magnet for a few days.
Day traders know that the Emini is at resistance. As a result, there is an increased chance of an unusually big trend day up or down. But they will continue to expect trading range price action and reversals until they see a strong breakout up or down.
Friday’s setups
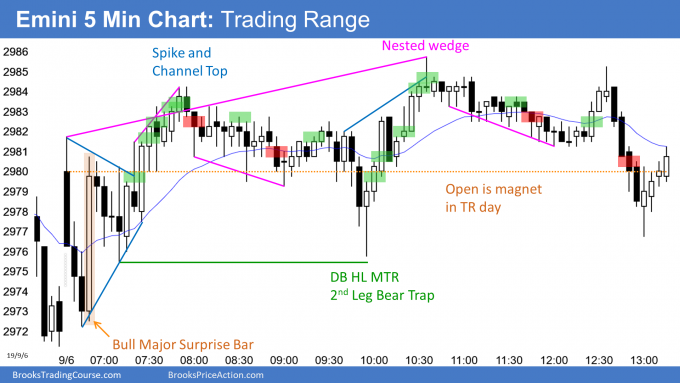
Here are several reasonable stop entry setups from Friday. I show each buy entry with a green rectangle and each sell entry with a red rectangle. I rarely also show limit order entries and entries on the close of bars. Buyers of the Brooks Trading Course and Encyclopedia of Chart Patterns have access to a much more detailed explanation of the swing trades for each day.
My goal with these charts is to present an Always In perspective. If a trader was trying to be Always In or nearly Always In a position all day, and he was not currently in the market, these entries would be logical times for him to enter.

