Who is Kevin Hassett? Wolfe looks at the Trump ally tipped to become Fed Chair.
Pre-Open Market Analysis
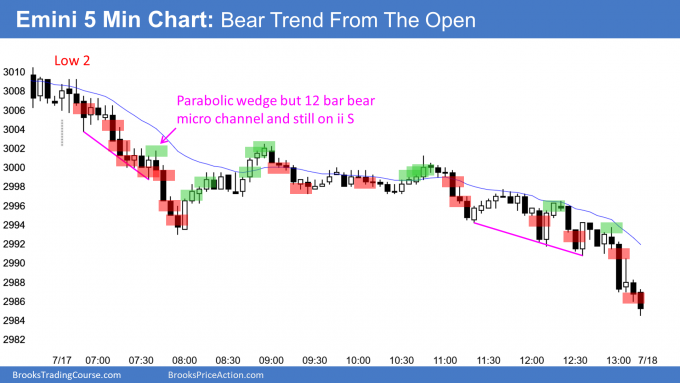
Yesterday was a spike-and-channel bear-trend day on the Emini 5-minute chart. Also, it was a surprisingly big bear day on the daily chart. A Bear Surprise Day typically has at least a small 2nd leg sideways to down within a week.
But when a Bear Surprise Day forms in a bull trend, the follow-through on the next day is usually disappointing for the bears. Consequently, today will probably not be a big bear day. In fact, there is an increased chance of at least a small bull day. This would would disappoint the bears who want a strong follow-through day after yesterday’s big bear day.
They are hoping this reversal is the start of a bear trend. More likely, it is the beginning of a 2 – 3 week pullback in a bull trend. The targets are the higher lows in the month-long bull channel. The June 12 low around 2900 is the lowest likely goal.
Pullbacks typically lack consecutive big bear trend days. However, if the bears get another big bear day today, that will increase the chance of a bigger reversal, like down to the June low.
If this week trades below last week’s low, this week will be an outside down bar on the weekly chart. That would be a stronger sell signal bar on that chart. After a 7 week bull micro channel, a 2 – 3 week minor reversal is more likely than a bear trend.
Overnight Emini Globex Trading
Since yesterday was a sell climax on the 5-minute chart, there is a 75% chance of at least a couple hours of sideways to up trading that starts by the end of the 2nd hour. Traders expect a disappointing follow-through day for the bears. There is therefore an increased chance of at least a small bull trend today. Day traders will watch for a reversal up in the 1st 2 hours.
There is a 25% chance of another big bear day today. If the bears get it, it will increase the odds of a bigger correction. A reasonable target would be the June low around 2750.
Yesterday’s Setups

Here are several reasonable stop entry setups from yesterday. I show each buy entry with a green rectangle and each sell entry with a red rectangle. I rarely also show limit order entries and entries on the close of bars. Buyers of the Brooks Trading Course and Encyclopedia of Chart Patterns have access to a much more detailed explanation of the swing trades for each day.
My goal with these charts is to present an Always In perspective. If a trader was trying to be Always In or nearly Always In a position all day, and he was not currently in the market, these entries would be logical times for him to enter.
