The Emini had a streak of 9 consecutive bull bars that ended this week. Traders should expect a 10% correction to begin by the end of the month.
Bond Futures are correcting down from a Spike and Channel Bull Trend on the daily chart. The selloff should test the June 16 low and then the bond futures will probably go sideways for a couple weeks.
The EUR/USD Forex weekly chart has 8 consecutive bull bars. This has not happened since 2004. Traders should expect a pullback at least to the June 10 high to begin within a couple weeks.
30 year Treasury Bond futures pulling back
Monthly bond futures in August reversed July rally
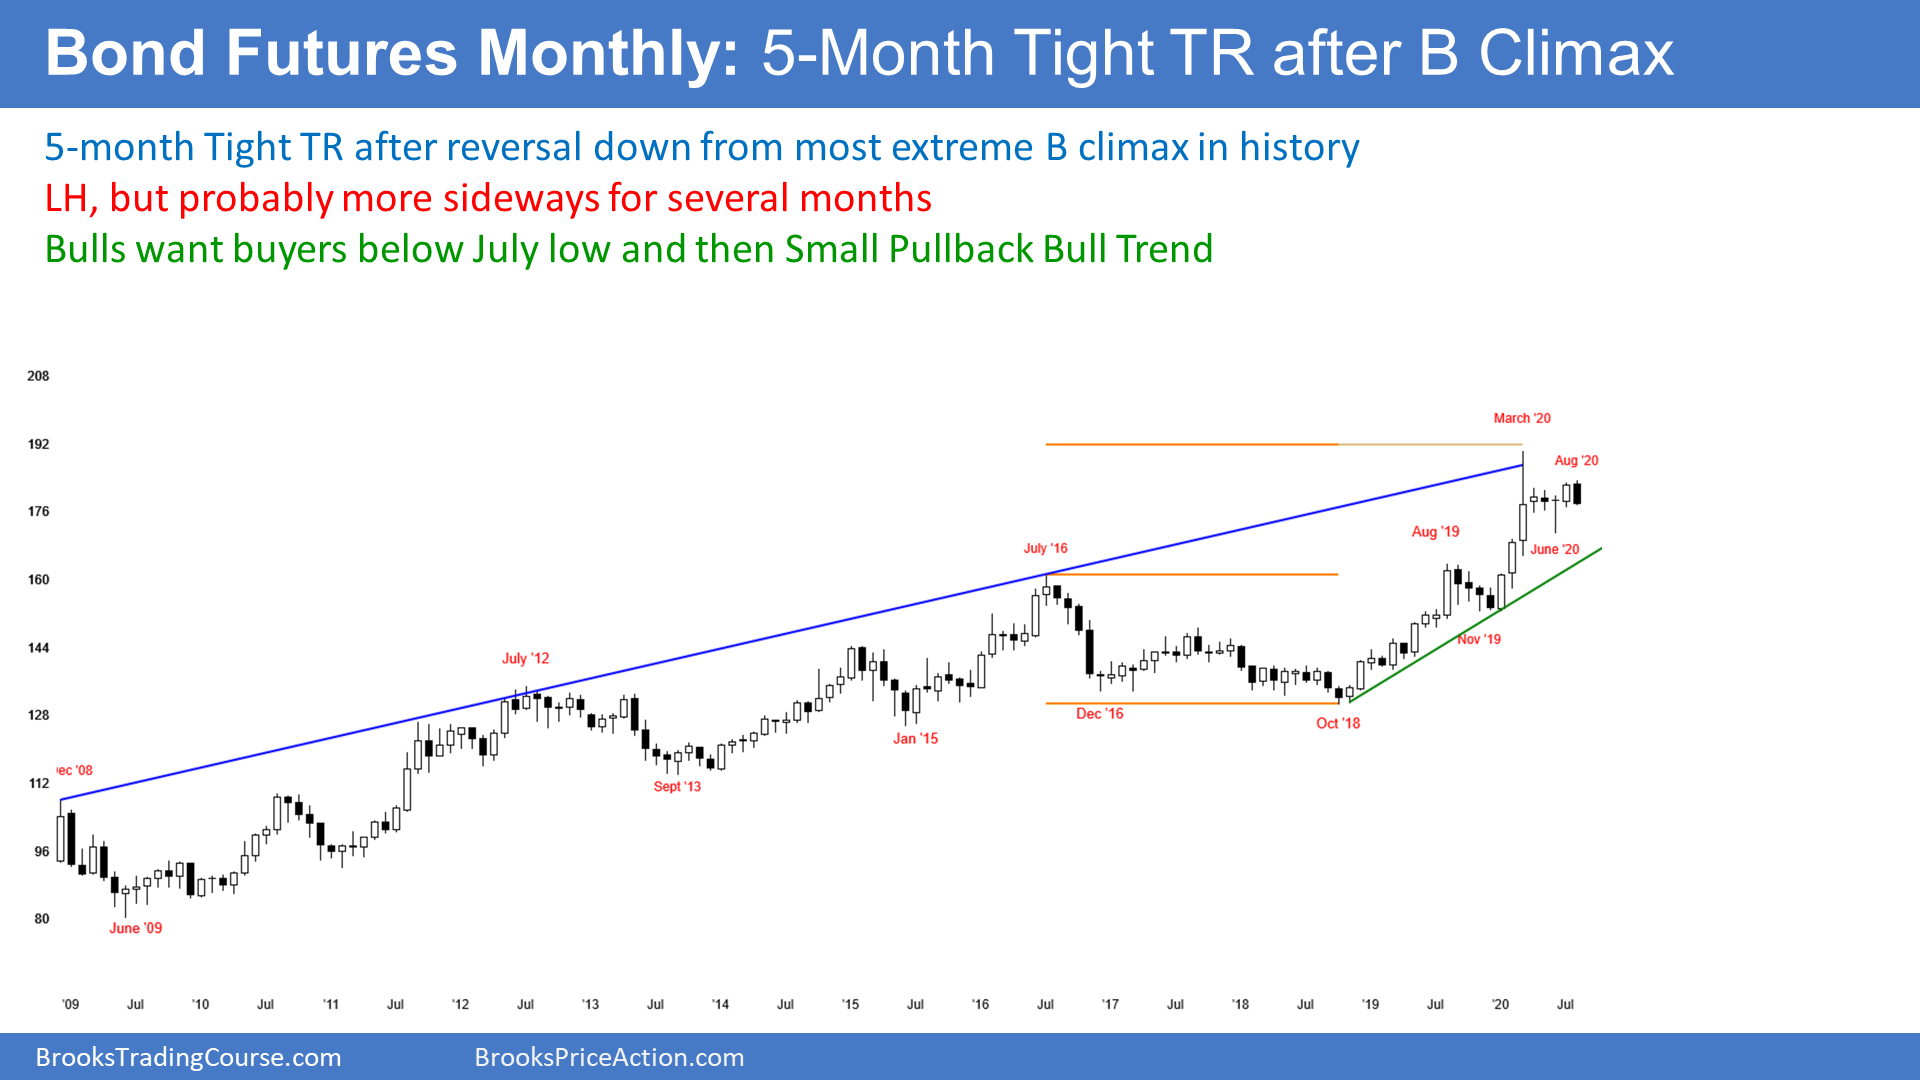
The 30 year Treasury bond futures monthly chart in August totally reversed the July rally. June was a buy signal bar. At the time, I said that it was a weak buy setup. This is because it was a doji bar and it was only 3 months after a reversal down from the biggest buy climax in history. I wrote many times that the most likely outcome was for the bond market to go sideways for the remainder of the year. This is still true.
The bulls were hoping that July was going to be the start of a rally to a new high. I said that most traders would only believe that if August was a strong follow-through month. The wanted to see a 2nd big bull bar closing on its high. Instead, August so far is a big bear bar trading at its low and totally reversed July. There are still 2 weeks left and the month could be back to neutral or even bullish by the end of the month, but that is unlikely.
Is the monthly chart now bearish? No. When a chart is sideways, it often has one or two strong bars up or down. Unless there are consecutive strong trend bars in either direction, the chart is more likely to go sideways.
How big will the pullback from the March buy climax be?
My default estimate for a pullback after a buy climax is that it has at least 2 legs sideways to down and lasts about 10 bars. If the trend tries to resume before then, most bulls are usually still in profit taking mode. They like to see the bears make 2 or 3 failed attempts at reversing the trend down before they will be eager to buy again.
So far, June has been the only leg down. The bulls are not certain that the bears have made their best effort yet. They want to see the bears try 2 or 3 times and fail. There would then be either a double bottom bull flag or a wedge bull flag. By the time the pattern becomes clear, the exhausted bulls will be rested and more willing to buy again. The monthly chart has probably not corrected long enough for traders to expect the bull trend to resume.
Will the bull trend resume?
Does the bull trend have to resume? Not at all. This bull trend has lasted several decades. Most trends in the bond market last 20 to 30 years. Consequently, traders should be open to the prospect of a reversal down for a decade or more.
The bears have not done enough to make traders believe a bear trend has begun. on the monthly chart. But the bulls have a problem. They can maybe get one more new high but probably not much more. A new high means interest rates will fall further. People will wonder if Trump will get his way and get negative rates.
But, I have said many times that Americans will not accept negative interest rates. Too many retirees depend on interest bearing accounts. And there are too many retirees for politicians to take that income away.
Bond futures daily chart reversed down from Spike and Channel rally
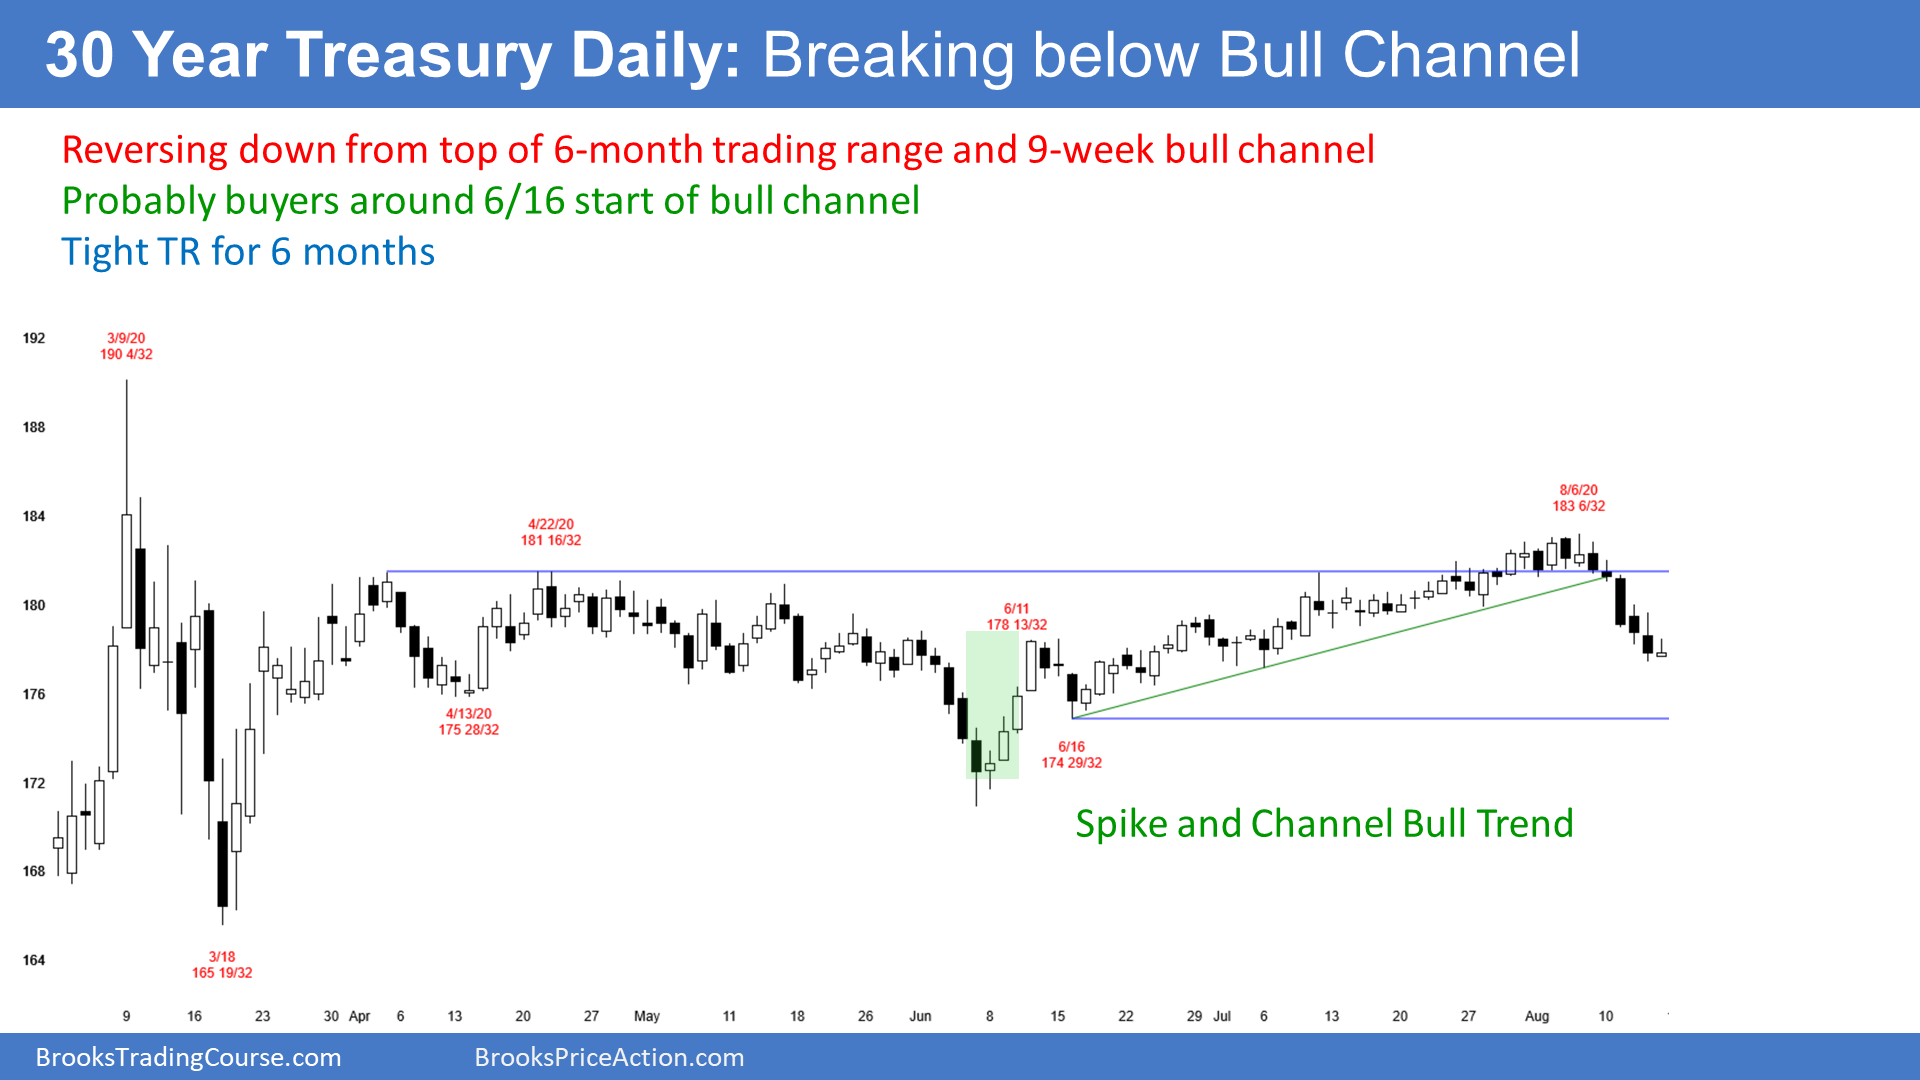
The daily bond futures rallied sharply to the June 11 high from a sell climax that ended with the June 5 low. That bull reversal was a spike up. After pulling back for 3 days, the rally converted to a bull channel.
The Spike and Channel Bull Trend ended with a wedge buy climax on August 6. The bond futures sold off sharply this week.
A wedge bull channel typically leads to a swing down that has 2 or more legs. A wedge is a buy climax ,and the reversal down from a buy climax usually has 2 or more legs. This week was the 1st leg down. The bears will sell the 1st bounce to a lower high in the next week or two, expecting at least one more leg sideways to down.
Support is at the start of the bull channel
The target is the start of the bull channel. That is the June 16 low of 174 29/32. Once the selloff reaches around that support, traders expect a bounce and then a trading range. They then watch for the next pattern to develop from within that trading range.
Will this selloff follow the textbook path that I just outlined? Nothing ever happens as expected. However, the overall concept will probably unfold. Traders expect a couple legs down to support and then confusion, which means a trading range for a couple weeks.
Can the selloff continue down to the June 5 sell climax low or even break strongly below it? Anything is possible, but a trading range will probably begin within a week. This is consistent with the monthly chart where the 5 month trading range could last all year.
EUR/USD Forex market stalling at the September 2018 high
August is follow-through bar on EUR/USD Forex monthly chart
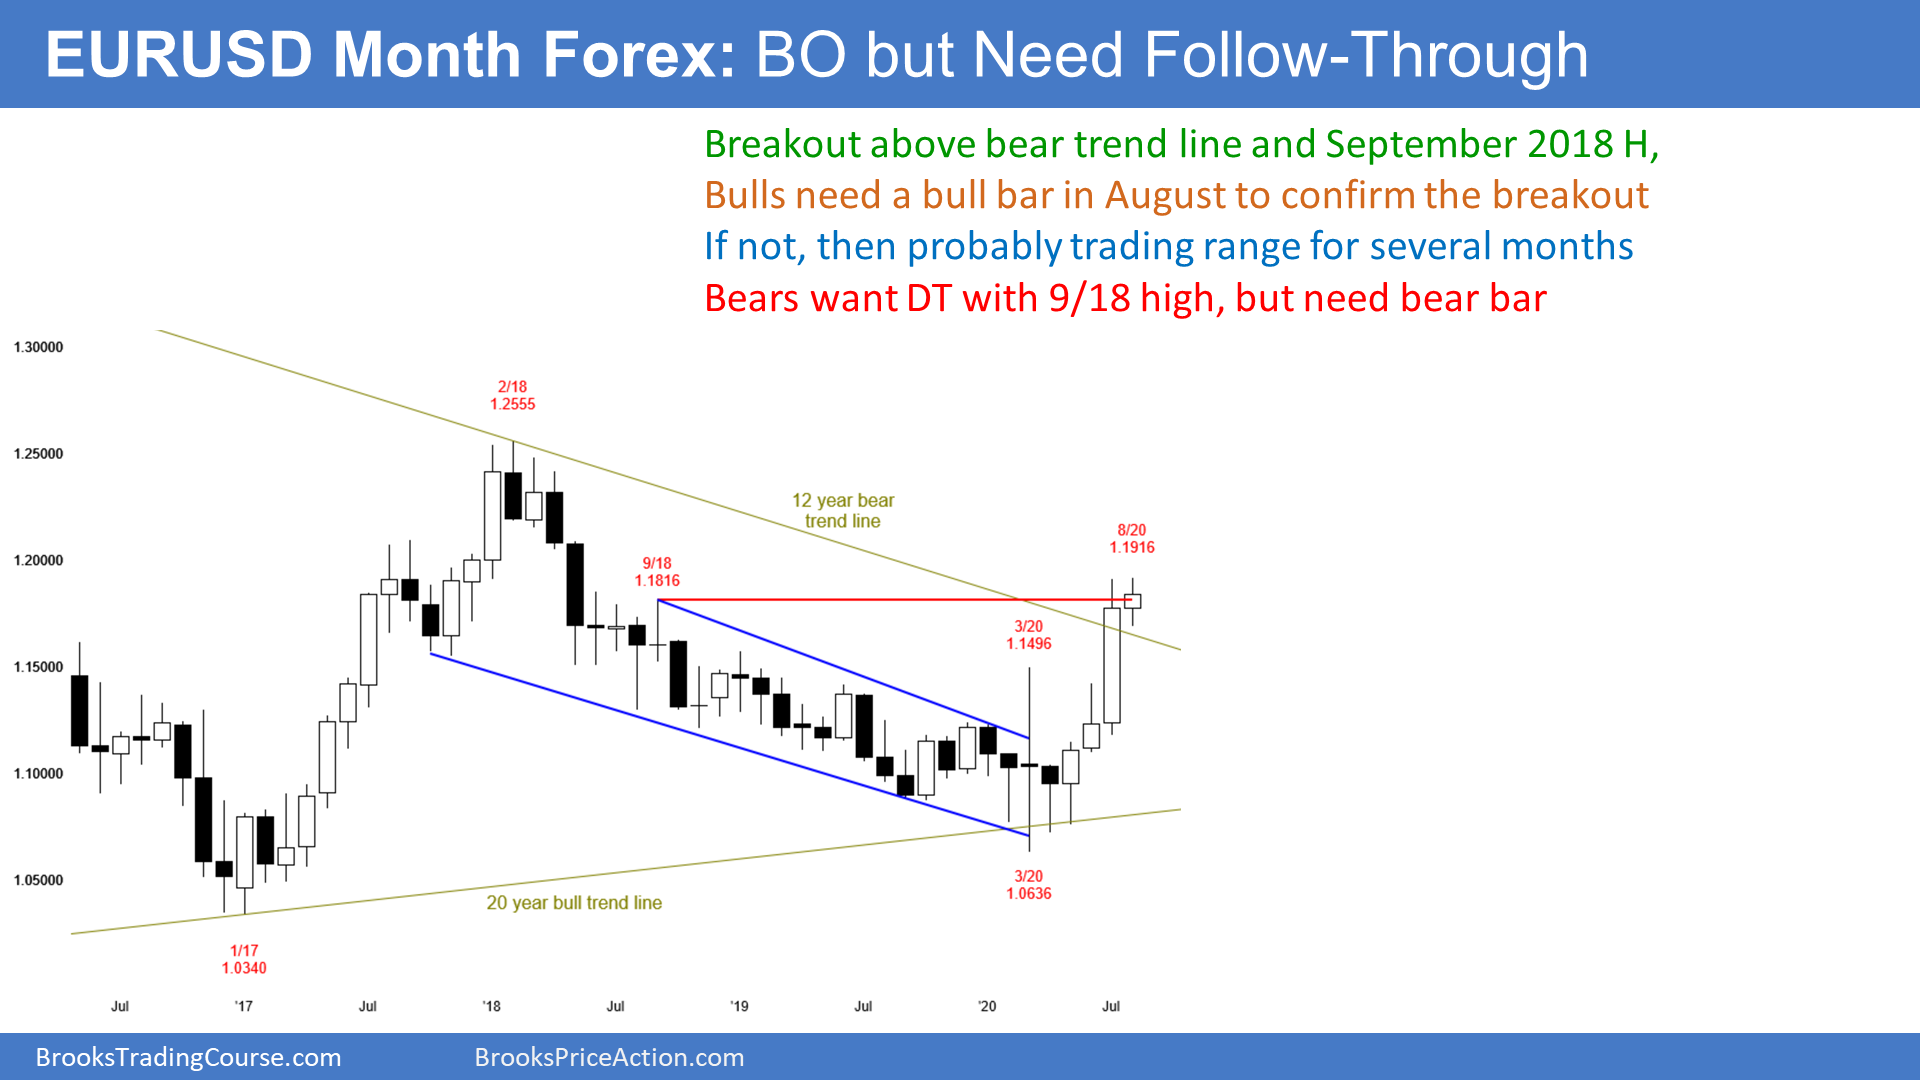
The EUR/USD Forex monthly chart had a huge bull bar in July. It broke above a 2 year bear trendline and above the September high. That was the start of the bear channel, and that is a magnet once a Spike and Channel Bear Trend finally ends.
July was a Bull Surprise Bar. Traders expect at least a small 2nd leg sideways to up.
But I have been saying for several weeks that August will be important. If August is a 2nd big bull bar closing near its high, the breakout will probably reach the February 2018 high before the end of the year.
However, August will probably not be a big bull bar. Why? Because the 1st rally after a Spike and Channel Bear Trend typically stalls around the start of the bear channel. As I said, that is the September 2018 high.
If August is a bull bar, it will probably be small. While that will increase the chance of at least slightly higher prices within the next few bars (months), it would be a sign that the rally has lost momentum. Traders would expect the EUR/USD to be sideways for a month or two.
What if August closes on its low? Then September will probably pull back. If August is a big bear bar closing on its low, not only will the bulls exit, many bears will sell. They will conclude that the July bull breakout will likely fail. They will see it as a bull trap and a double top with the September 2018 high.
EUR/USD weekly chart has had 8 consecutive bull bars
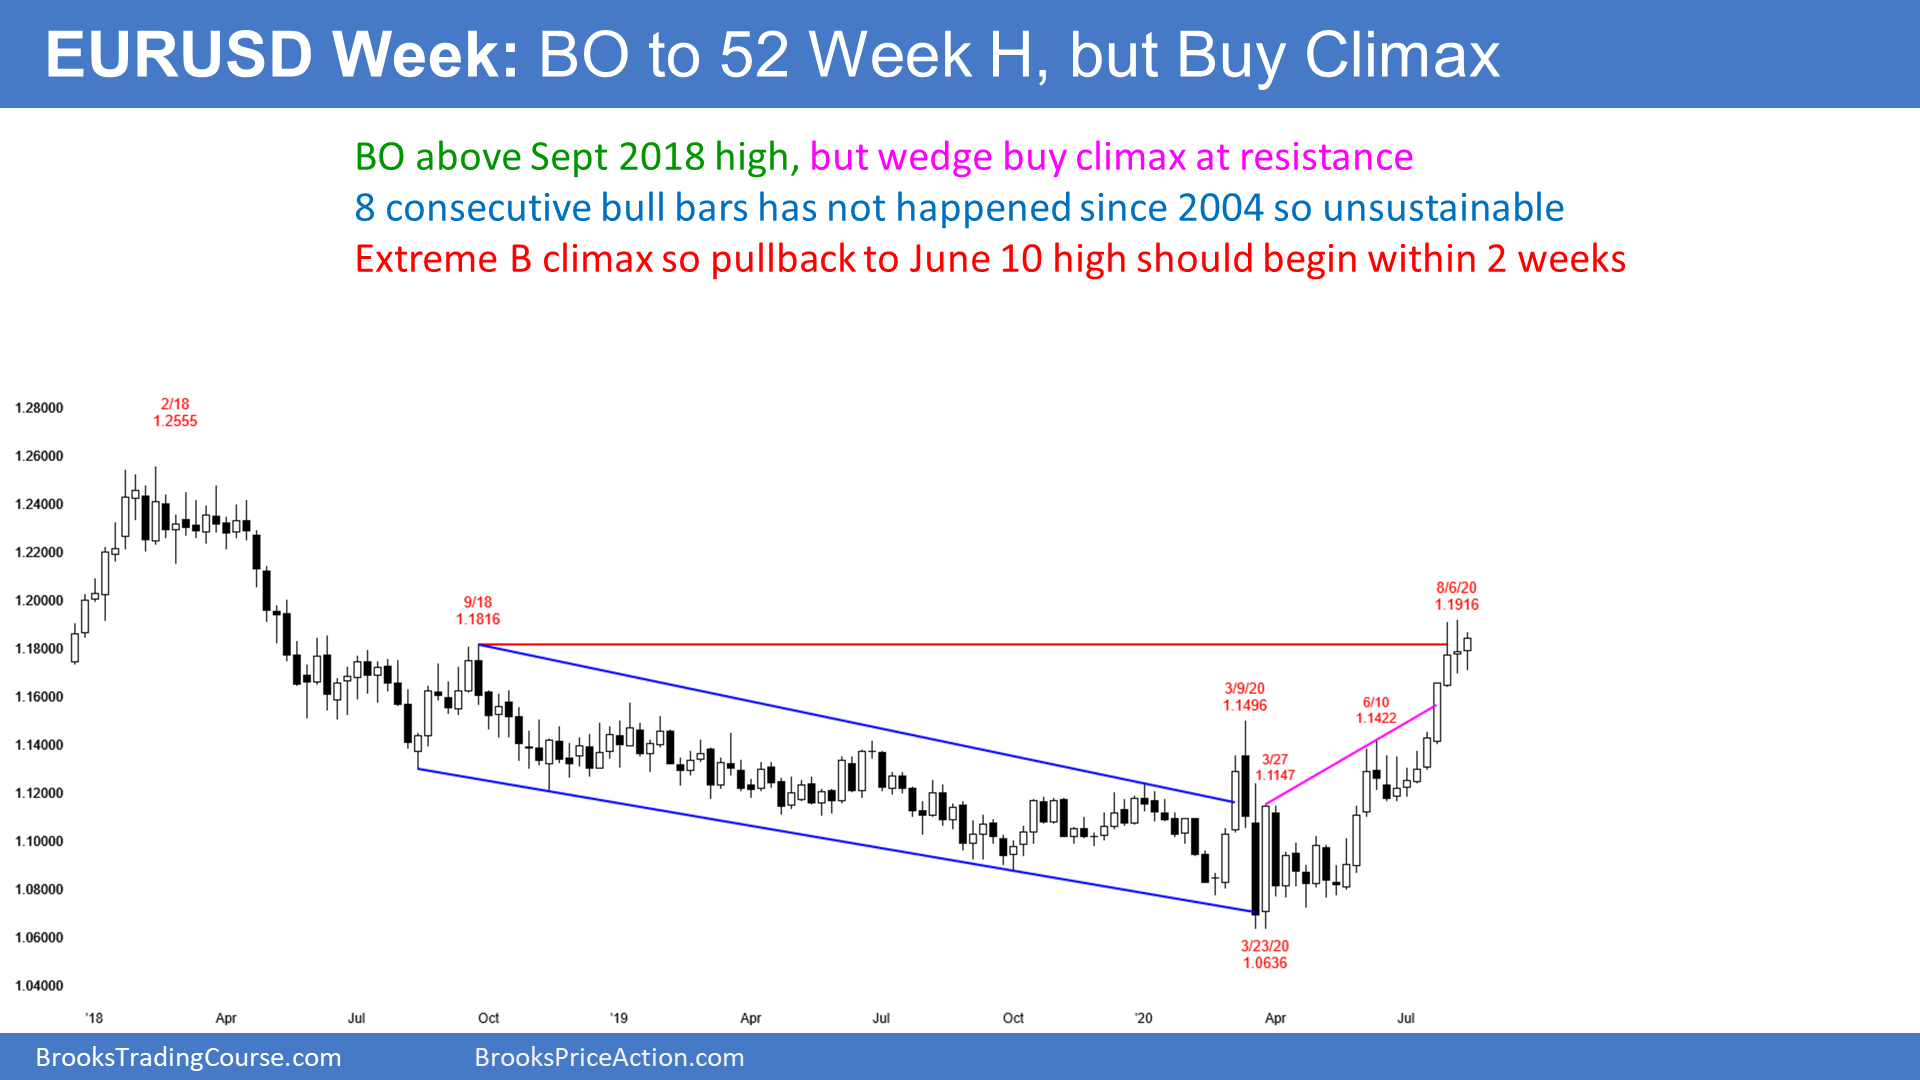
This was the 8th consecutive week on the weekly chart with a bull body. That is unusual and therefore unsustainable. It is therefore a type of buy climax.
Traders expect a bear bar next week. This is especially true since the weekly chart has been sideways for 3 weeks. The bull trend is losing momentum. Also, the past 2 weeks were doji bars. They closed near the open. That means the bears were about as strong as the bulls.
Traders sense that the rally is climactic, but most are unaware of the 8 consecutive bull bars and how unusual that is. The last time this happened was in 2004. The streak at that time was 11 consecutive bull bars. There was a small 2nd leg up and then a yearlong selloff that continued down to below all 11 bull bars. That is an example of why I refer to this as a buy climax.
Will the EUR/USD reverse down to below the low of the 8 bull bars this time? It might because that is the bottom of the 3rd leg up in the wedge. That is a common target for a reversal after a wedge.
EUR/USD daily chart in Breakout Mode
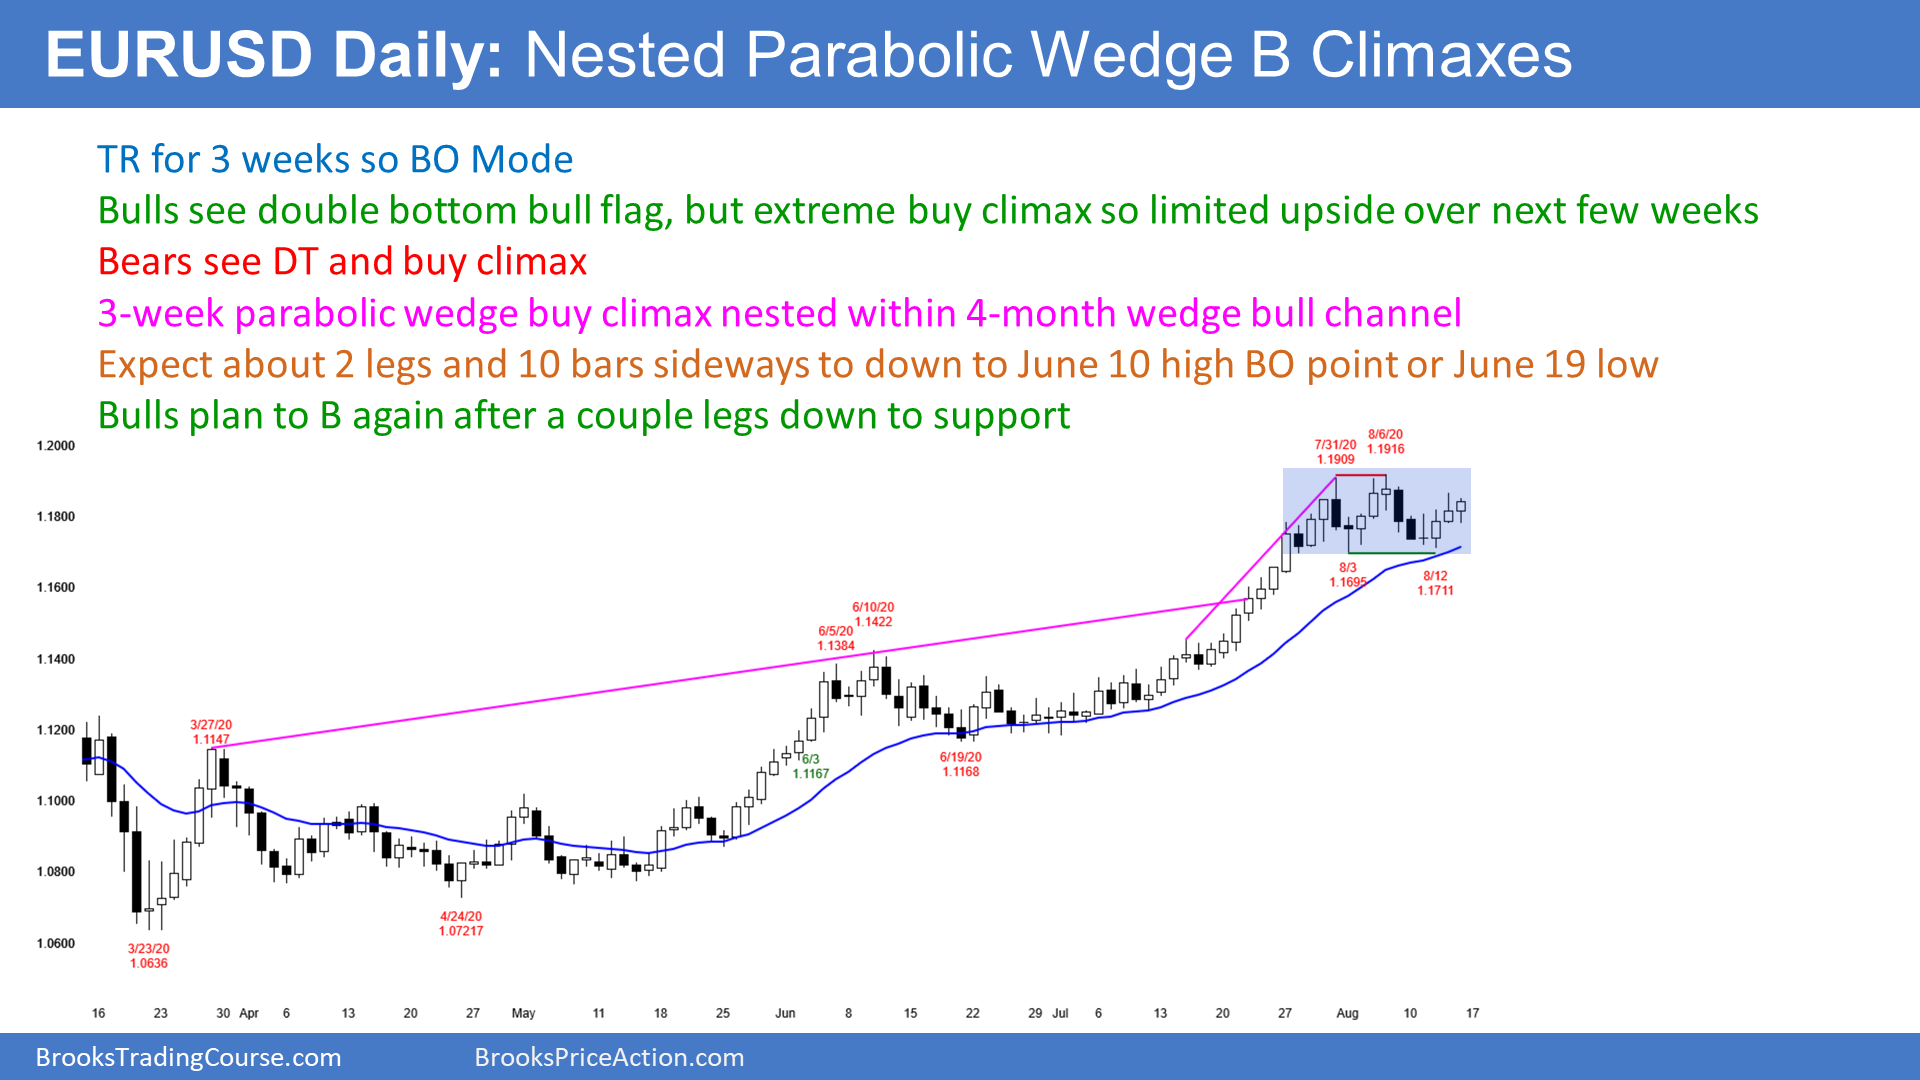
Because the EUR/USD has reached its most important target, albeit quickly, traders will probably be uncertain about what will follow. Confusion is a hallmark of a trading range, and the daily chart has been sideways for 3 weeks.
A trading range is a Breakout Mode pattern. There is a 50% chance of a successful bull breakout and a 50% chance of a successful bear breakout. Furthermore, there is a 50% chance that the 1st breakout up or down will fail.
Bears want a reversal down from a small double top
Every trading range has both a buy and sell setup. The bears want a measured move down from the small double top. That would be a test of the June 10 high breakout point. It might also fall to the June 19 start of the last leg up.
However, the bull trend has been strong. A reversal down, even to that low, would probably lead to a trading range and not a bear trend. There would probably be a test a few weeks later back up to the August high. Therefore, if there is a measured move down, there probably then will be a reversal back up into the trading range.
The bulls want the bull trend to resume up from a double bottom bull flag
The bulls see the 3 week trading range as a bull flag. But a bull flag late in a bull trend is usually the Final Bull Flag. This is especially true when there is a buy climax. The 6 month nested wedge rally is a buy climax.
When there is a break above any bull flag, traders look for around a measured move up. But if the flag is a good candidate for a Final Flag, traders then look for a reversal back down to the bottom of the flag. Therefore, if there is a measured move up, there will probably then be a reversal back into the trading range.
Since a bull or bear breakout will probably return to the trading range within a month or two, the EUR/USD daily chart will probably evolve into a big trading range for a couple months.
S&P500 Emini futures buy climax at February high
Monthly Emini chart in strong 5 month rally to new all-time high
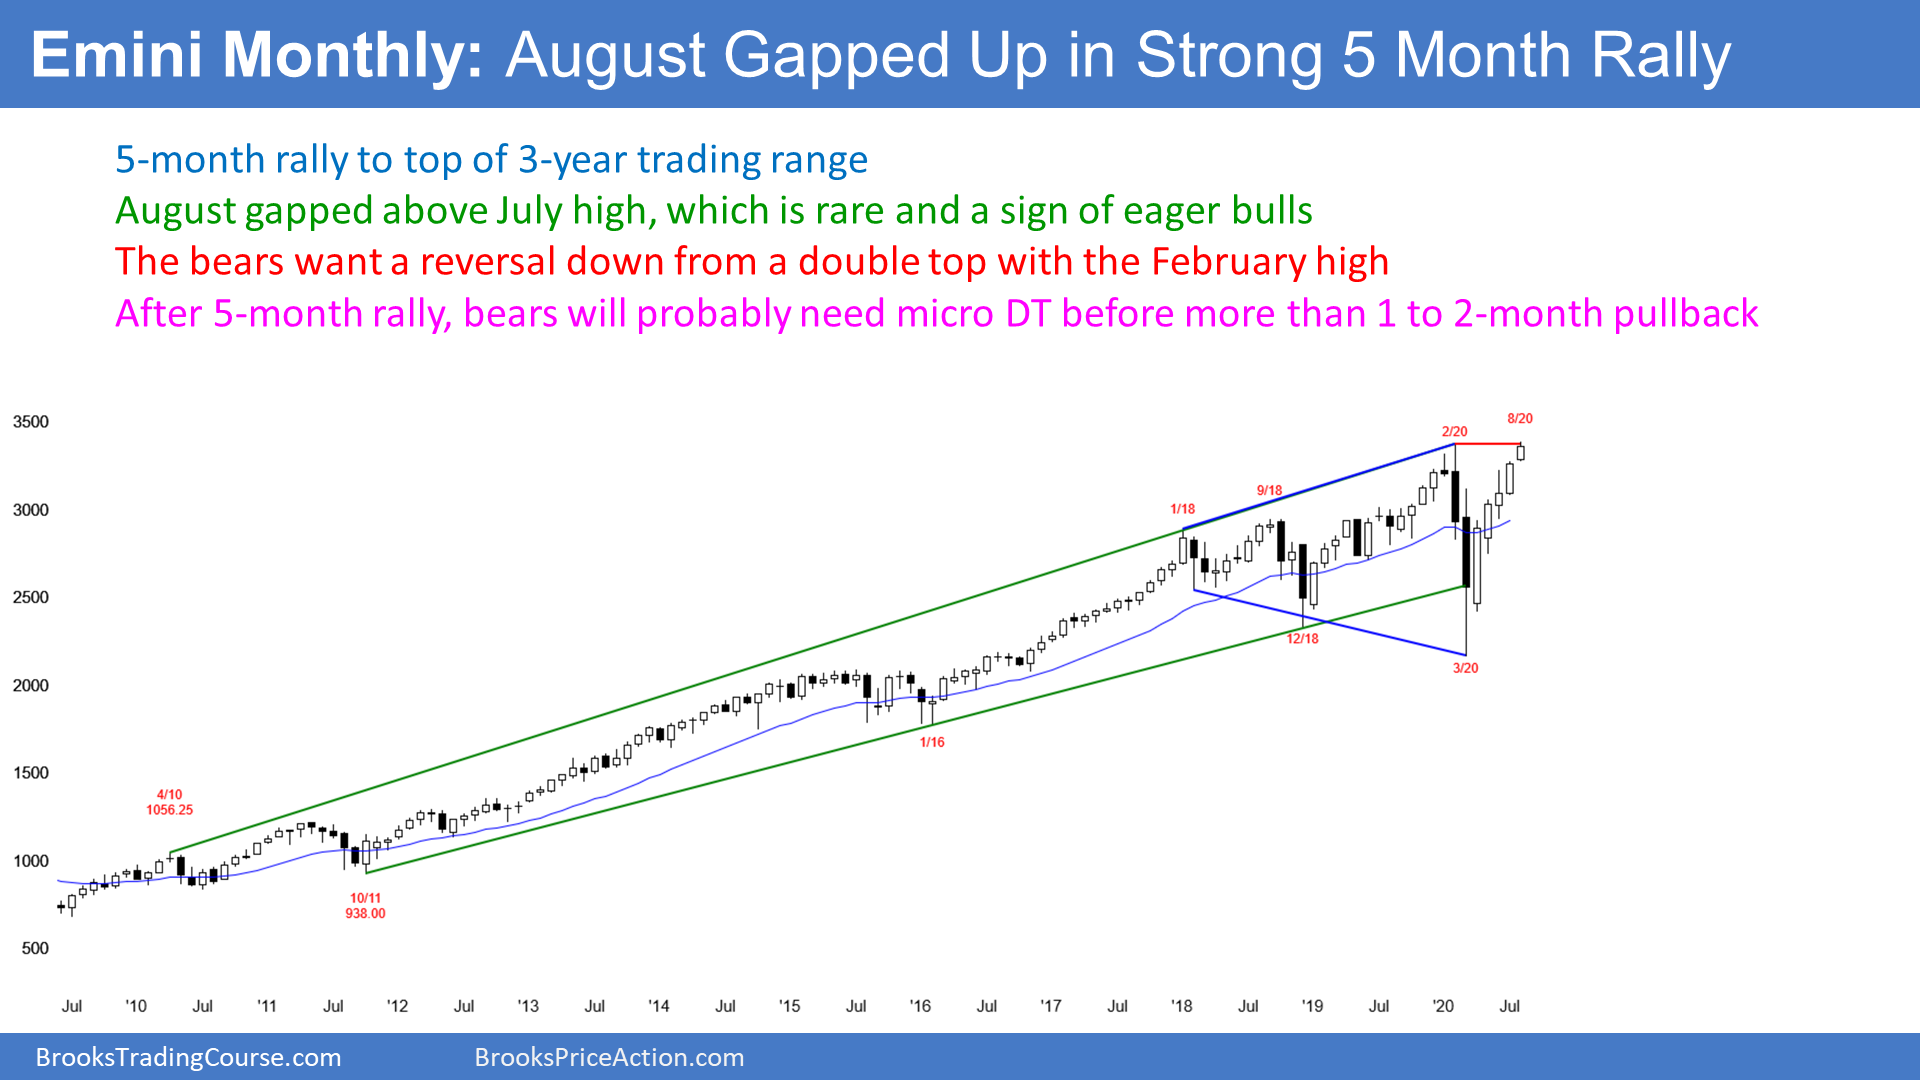
The monthly S&P500 Emini futures chart has rallied strongly for 5 months from the March sell climax down to the 10 year bull trend line. While the Emini broke above the February high, the breakout so far has been small.
Also, there are 2 weeks left to the month and August could look very different once the bar closes. For example, the range is not big. Therefore, a 2 week selloff could reverse down to below the open of the month. August would then be a bear reversal bar and a sell signal bar for a double top with the February high.
But even if that were to happen, the 5 month rally was surprisingly strong. A Bull Surprise rally typically has at least a small 2nd leg up. Consequently, traders will buy the 1st reversal down.
This is true even if it is big and fast. A strong bull trend like this usually cannot immediately reverse into a bear trend without at least forming a micro double top first.
To create a micro double top, there needs to be a 1 – 2 bar selloff and then a rally back up to around the old high. In this case, if the selloff begins in August, the August high would be a magnet 2 – 4 months from now.
How much higher can the bull trend go?
Can the 5 bar (month) rally grow into a 10 bar rally? While possible, that is unlikely. Traders already see this rally as overdone.
The stops for the bulls are below the March low. Traders are therefore risking about 35%. Risk managers at trading firms will soon start to tell traders to take some profits to reduce that risk. Therefore, even if the rally goes a lot higher, there will probably be at least a 1 month pullback starting within a couple months.
Weekly S&P500 Emini futures chart
Wedge rally to possible double top
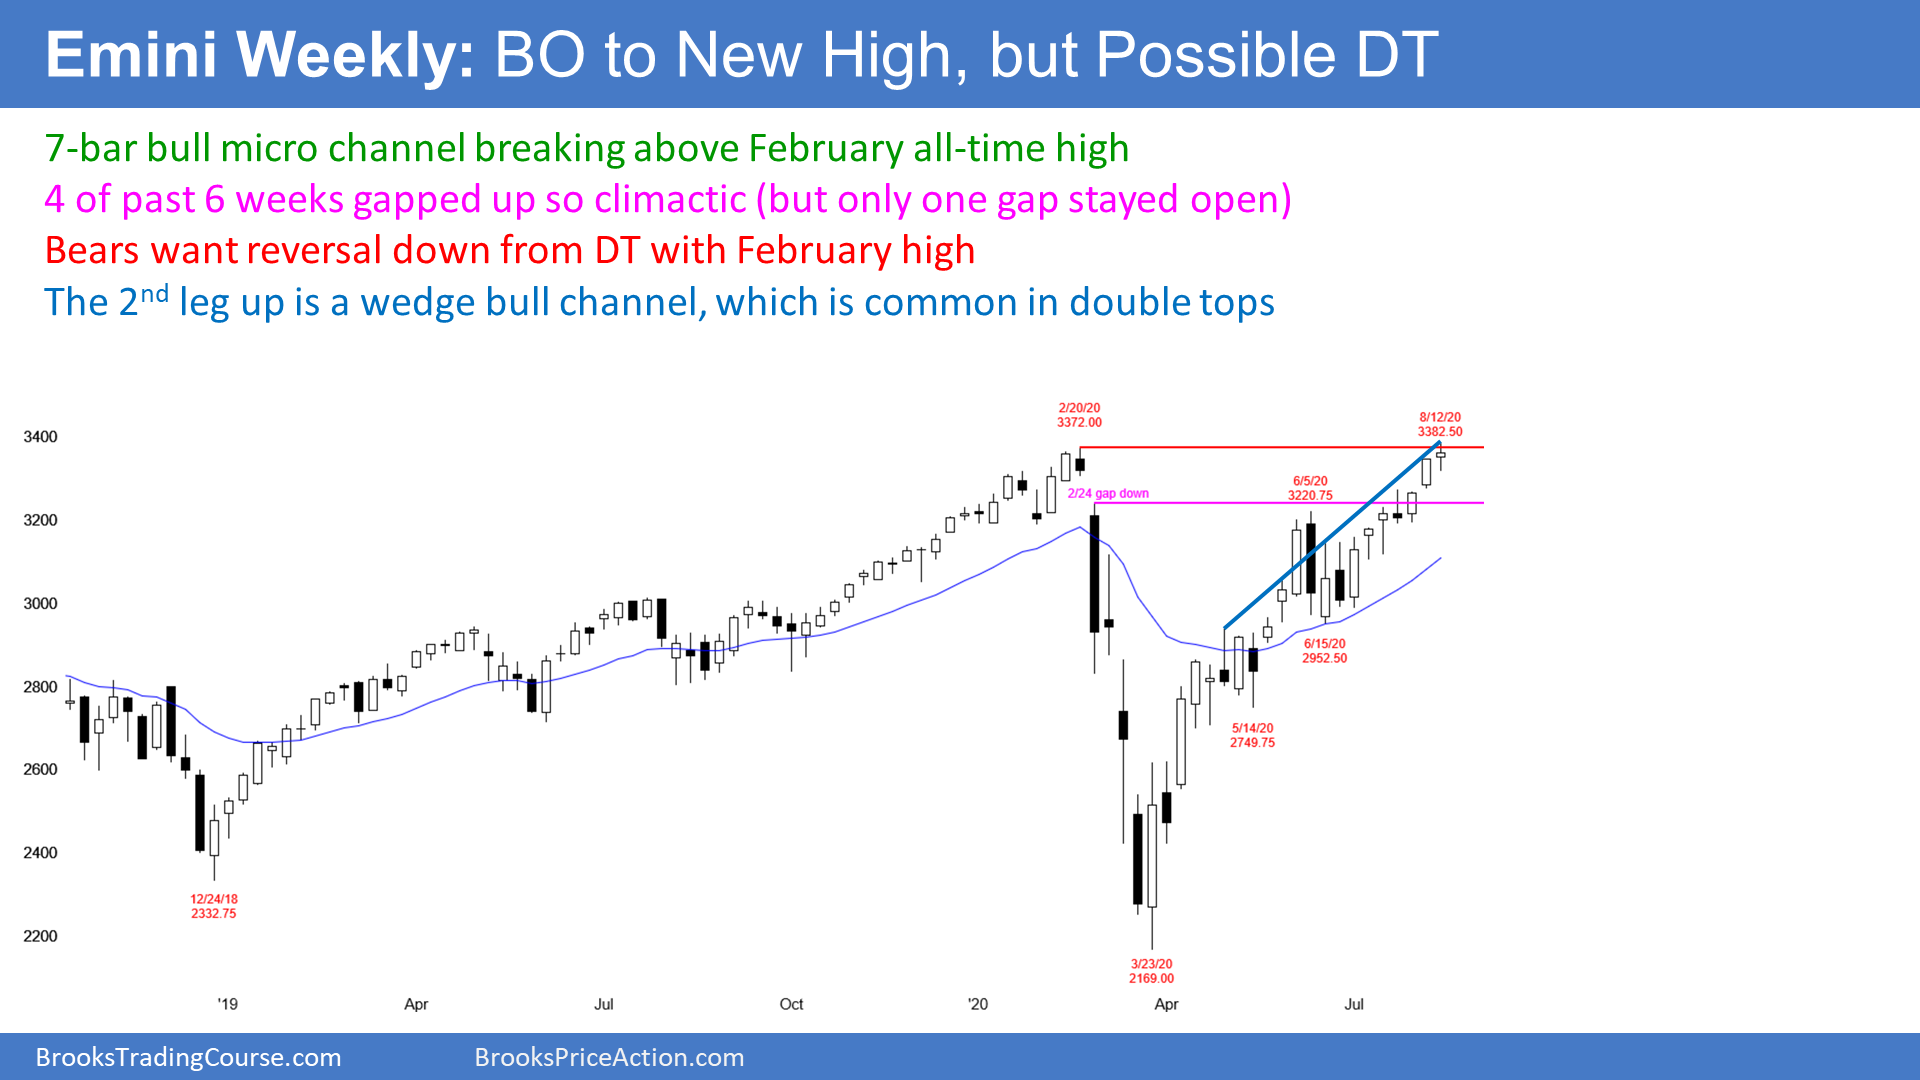
The weekly S&P500 Emini futures chart gapped up on 4 of the past 6 weeks so the bulls have been aggressive. However, only one of the gaps remained open, which is not what traders expect in a bull trend that will go much higher. Something is wrong. Also, this week barely broke to a new all-time high, but it closed below the February high.
As strong as the 5 month rally has been, this is the 3rd leg up from the March low. This is therefore a wedge rally to a possible double top. That combination is a common reversal pattern. Also, the 3rd leg up is a 7 bar bull micro channel, which is a buy climax. While there is no reversal yet and the Emini could continue much high, the odds now favor a pullback beginning soon from this area.
In June, there was a tight trading range. It came late in a bull trend and it is therefore a candidate for a Final Bull Flag. If there is a reversal down from around the February high, traders will expect it to reach the bottom of that flag. That is around 3,000 and it would be about a 10% correction.
Daily S&P500 Emini futures chart
After 9 consecutive bull bars, pullback likely soon
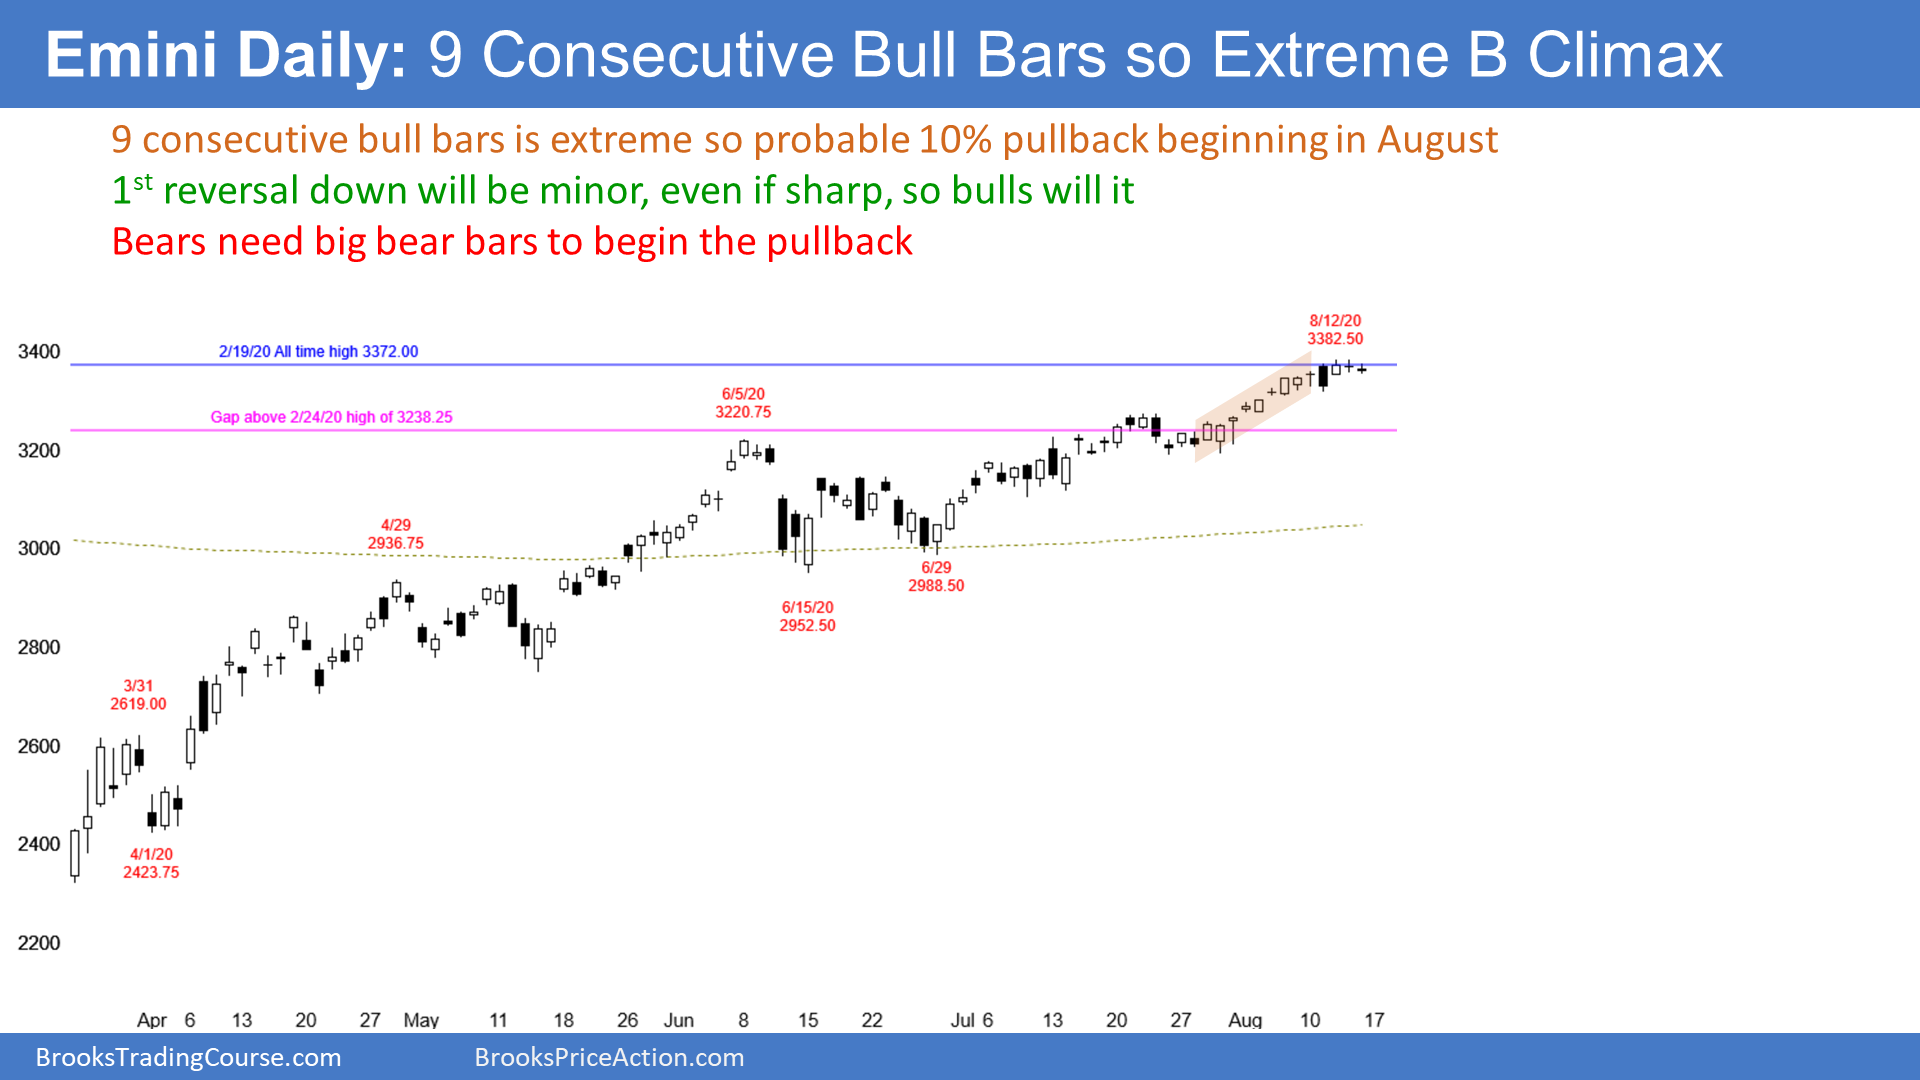
The daily S&P500 Emini futures chart broke to a new all-time high this week. But it was too strong. The rally had 9 consecutive bull bars. Since that is rare, it is unsustainable and a buy climax.
There were 8 consecutive bull bars in June. Five days later, the Emini was down 8%.
The next earlier time with 8 consecutive bull bars was in January of 2018. That streak was 9 bars, like the current one. That rally was the 1st leg up in a parabolic wedge buy climax. The top came 9 days later and the Emini sold off 10% over the next 2 weeks.
Traders should expect a similar pullback after this buy climax. Will there be a couple more brief legs up to a parabolic wedge top like in 2018? This rally does not look climactic enough for that. More likely, it will begin to turn down before the end of the month without going much higher. The bulls might want the cash index to make a new all-time high first.
On the cash chart, institutions look at the close. This week poke above the February highest close a couple times but could not close above it. The bulls will likely try again next week. The will probably succeed, but traders should still expect a minor reversal to start before the end of the month.
A common target is the bottom of the most recent buy climax. That is the low of the 1st of the 9 bull bars and it is around 3200. Below that is the June trading range at around 3000. Since that is about 10% down and that is comparable in size to the other streaks that I mentioned, the Emini will probably get there before the end of September.
