In my early January Emerging Markets update, I pointed out a few reasons why the Emerging Markets (EEM) may begin to lag. And more precisely, why bulls needed to see an EEM consolidation pattern emerge. For one, the index was overbought and in need of a cool down. But more importantly, the beta-friendly investing ETF was beginning to lag its beta brother, the Small Caps (IWM). And just five weeks later, the global financial markets have continued to surge higher while the Emerging Markets have continued to back and fill. Market rotation anyone?
But the chart still looks good with a wider lens. So what gives? And when will the EEM consolidation pattern end? Or will it turn into deeper pullback?
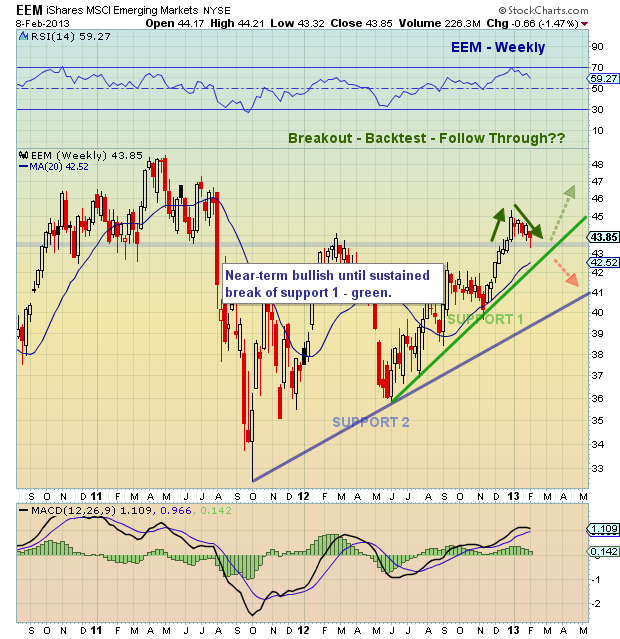
These are all good questions. So let’s look at the chart for some technical risk analysis. In December the index broke out above the February 2012 highs. Although the chart formation and the action were bullish, the weekly RSI (Relative Strength Index) touched 70, its highest recording since 2010. This has spurred the much-needed EEM consolidation pattern. And, to be honest, that consolidation could easily have turned into correction had the global financial markets not continued their stampede higher. And, in that same vein, if the global markets consolidate or pullback, this could hurt the recent consolidation formation. Food for thought.
Looking at the weekly bar chart below, support 1 is the near-term uptrend line and should provide support at $42.50-$43.00. Note as well the 20-week moving average at $42.52 as well. A successful retest, followed by a move higher would be bullish and target a retest of the 2011 highs. However, if this support area fails and sustains a move through support 1, then the EEM consolidation pattern may turn into a deeper pullback, possibly targeting support 2 (the intermediate term uptrend line).
Trade safe, trade disciplined.
Emerging Markets EEM consolidation pattern highlighting key technical support levels.
Original post
- English (UK)
- English (India)
- English (Canada)
- English (Australia)
- English (South Africa)
- English (Philippines)
- English (Nigeria)
- Deutsch
- Español (España)
- Español (México)
- Français
- Italiano
- Nederlands
- Português (Portugal)
- Polski
- Português (Brasil)
- Русский
- Türkçe
- العربية
- Ελληνικά
- Svenska
- Suomi
- עברית
- 日本語
- 한국어
- 简体中文
- 繁體中文
- Bahasa Indonesia
- Bahasa Melayu
- ไทย
- Tiếng Việt
- हिंदी
Emerging Markets: EEM Consolidation Pattern Nearing Completion?
Published 02/12/2013, 04:50 AM
Updated 07/09/2023, 06:31 AM
Emerging Markets: EEM Consolidation Pattern Nearing Completion?
Latest comments
Loading next article…
Install Our App
Risk Disclosure: Trading in financial instruments and/or cryptocurrencies involves high risks including the risk of losing some, or all, of your investment amount, and may not be suitable for all investors. Prices of cryptocurrencies are extremely volatile and may be affected by external factors such as financial, regulatory or political events. Trading on margin increases the financial risks.
Before deciding to trade in financial instrument or cryptocurrencies you should be fully informed of the risks and costs associated with trading the financial markets, carefully consider your investment objectives, level of experience, and risk appetite, and seek professional advice where needed.
Fusion Media would like to remind you that the data contained in this website is not necessarily real-time nor accurate. The data and prices on the website are not necessarily provided by any market or exchange, but may be provided by market makers, and so prices may not be accurate and may differ from the actual price at any given market, meaning prices are indicative and not appropriate for trading purposes. Fusion Media and any provider of the data contained in this website will not accept liability for any loss or damage as a result of your trading, or your reliance on the information contained within this website.
It is prohibited to use, store, reproduce, display, modify, transmit or distribute the data contained in this website without the explicit prior written permission of Fusion Media and/or the data provider. All intellectual property rights are reserved by the providers and/or the exchange providing the data contained in this website.
Fusion Media may be compensated by the advertisers that appear on the website, based on your interaction with the advertisements or advertisers.
© 2007-2025 - Fusion Media Limited. All Rights Reserved.
