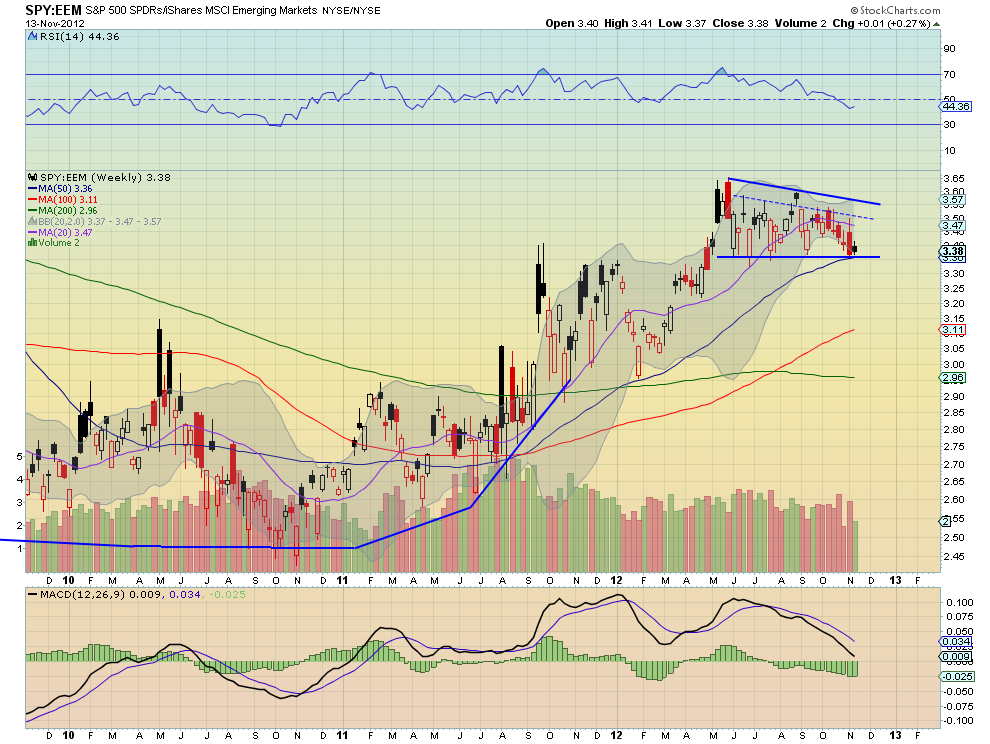
Many traders and investors use the relationship between Emerging Markets (EEM) and the S&P 500 (SPY) as a gauge for risk taking. Recently many have been lauding the Emerging Markets over the US Market, but not much has been happening.
Looking at the chart below, this metric is at a crucial level. After moving steadily higher since late 2010, the ratio of the S&P 500 to Emerging Markets has been consolidating since June. This is forming a descending triangle and a break below the base would trigger a target nearly 10% lower at 3.05. A relative move by Emerging Markets of 10% against the S&P 500. 
At the extremes, this would take the Emerging Market ETF from its current level of 40.80 to 44.88, or the S&P 500 lower to 1237. Of course, this could end up rebounding to the top of the triangle and breaking higher, into a bullish continuation.
There is no play to be made until it breaks down through the triangle. The Relative Strength Index (RSI) and Moving Average Convergence Divergence indicator (MACD) support the break lower so focus there.
Disclosure: The information in this blog post represents my own opinions and does not contain a recommendation for any particular security or investment. I or my affiliates may hold positions or other interests in securities mentioned in the Blog, please see my Disclaimer page for my full disclaimer.
Original post
- English (UK)
- English (India)
- English (Canada)
- English (Australia)
- English (South Africa)
- English (Philippines)
- English (Nigeria)
- Deutsch
- Español (España)
- Español (México)
- Français
- Italiano
- Nederlands
- Português (Portugal)
- Polski
- Português (Brasil)
- Русский
- Türkçe
- العربية
- Ελληνικά
- Svenska
- Suomi
- עברית
- 日本語
- 한국어
- 简体中文
- 繁體中文
- Bahasa Indonesia
- Bahasa Melayu
- ไทย
- Tiếng Việt
- हिंदी
Emerging Markets May Be Listening To The Pundits
Published 11/15/2012, 01:01 AM
Updated 05/14/2017, 06:45 AM
Emerging Markets May Be Listening To The Pundits
Latest comments
Loading next article…
Install Our App
Risk Disclosure: Trading in financial instruments and/or cryptocurrencies involves high risks including the risk of losing some, or all, of your investment amount, and may not be suitable for all investors. Prices of cryptocurrencies are extremely volatile and may be affected by external factors such as financial, regulatory or political events. Trading on margin increases the financial risks.
Before deciding to trade in financial instrument or cryptocurrencies you should be fully informed of the risks and costs associated with trading the financial markets, carefully consider your investment objectives, level of experience, and risk appetite, and seek professional advice where needed.
Fusion Media would like to remind you that the data contained in this website is not necessarily real-time nor accurate. The data and prices on the website are not necessarily provided by any market or exchange, but may be provided by market makers, and so prices may not be accurate and may differ from the actual price at any given market, meaning prices are indicative and not appropriate for trading purposes. Fusion Media and any provider of the data contained in this website will not accept liability for any loss or damage as a result of your trading, or your reliance on the information contained within this website.
It is prohibited to use, store, reproduce, display, modify, transmit or distribute the data contained in this website without the explicit prior written permission of Fusion Media and/or the data provider. All intellectual property rights are reserved by the providers and/or the exchange providing the data contained in this website.
Fusion Media may be compensated by the advertisers that appear on the website, based on your interaction with the advertisements or advertisers.
© 2007-2025 - Fusion Media Limited. All Rights Reserved.
