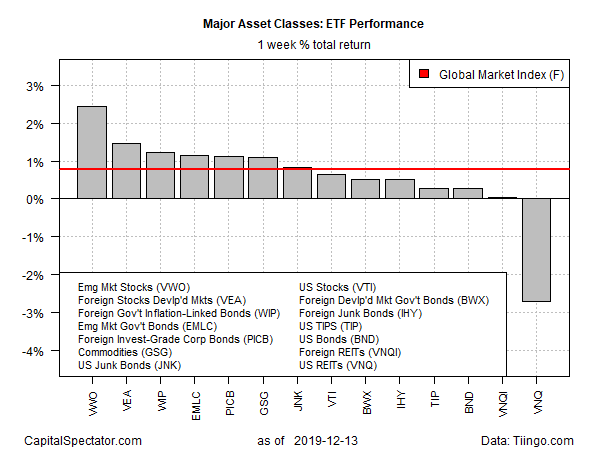
The recent bounce in emerging markets shares accelerated last week, delivering the strongest gain for the major asset classes over the five trading days through Dec. 13, based on a set of US-listed exchange-traded funds.
Vanguard FTSE Emerging Markets (NYSE:VWO) surged 2.4%. The gain – the strongest since August — marks the second weekly advance after a weak run previously.
Last week’s news that the US and China reached a partial trade agreement fueled a fresh wave of bullish sentiment in VWO’s stocks. But some analysts remain cautious, including Luciano Jannelli, head of investment strategy at Abu Dhabi Commercial Bank. “This is only a short-term solution,” he told Bloomberg TV on Sunday. “If you look at the lack of progress on the issue of China’s industrial policy — its subsidizing of specific business lines — the big issues have not been tackled yet.”
Buying was in fashion in nearly every corner of global markets last week. The only loss for the major asset classes: US real estate investment trusts (REITs). Vanguard Real Estate (VNQ) shed a hefty 2.7% — the fund’s biggest weekly loss in more than a month.
Widespread buying boosted an ETF-based version of the Global Market Index (GMI.F) — an unmanaged benchmark that holds all the major asset classes (except cash) in market-value weights. GMI.F rose 0.8%, the third straight weekly gain for the index.

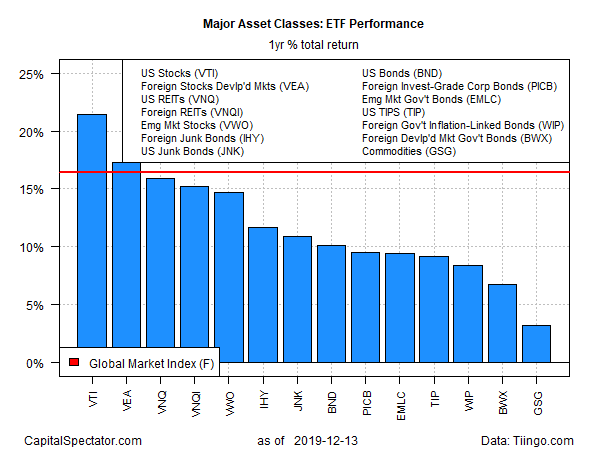
For the one-year trend, US equities remain firmly in the lead among the major asset classes. Vanguard Total Stock Market (NYSE:VTI) is up 21.4% on a total return basis. That’s a comfortable margin over the second-best one-year gain, posted by foreign stocks in developed markets via Vanguard FTSE Developed Markets (VEA), which is ahead by 21.1% over the trailing 12-month window.
Broadly defined commodities remain the weakest performer over the past year. The iShares S&P GSCI Commodity-Indexed Trust (NYSE:GSG) is up a relatively soft 3.2% at Friday’s close vs. the year-earlier price. But even a mild gain reflects progress for GSG, which had been sinking on a rolling one-year basis for much of 2019 until a few weeks ago.
Meantime, GMI.F is still posting a strong one-year gain: 16.4% after factoring in distributions.


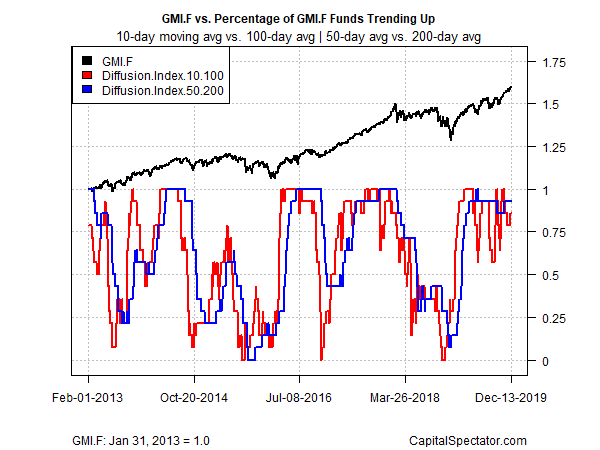
A momentum profile of all the ETFs listed above suggests that an upside bias will continue to support GMI.F. The analysis is based on two sets of moving averages. The first compares the 10-day moving average with its 100-day counterpart — a proxy for short-term trending behavior (red line in chart below). A second set of moving averages (50 and 200 days) represent the intermediate measure of the trend (blue line). With most asset classes still posting a bullish posture, GMI.F’s near-term outlook remains positive.
