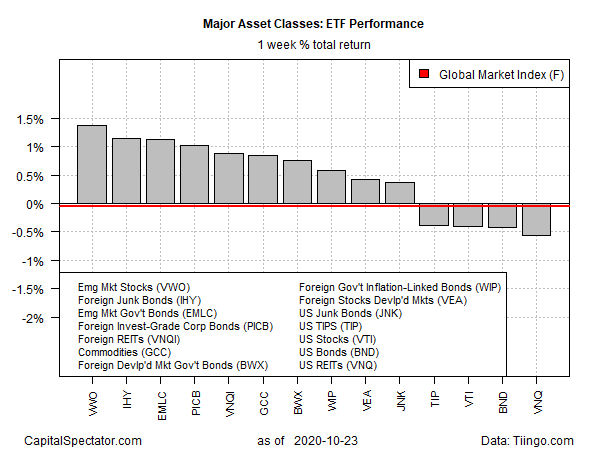
Shares and bonds in emerging markets, along with high-yield bonds ex-US, led returns for the major asset classes last week, based on a set of ETFs. Buoyed by a weak US Dollar index, which is close to a 2-1/2 low, foreign markets generally led trading action for the week through Friday, Oct. 23.
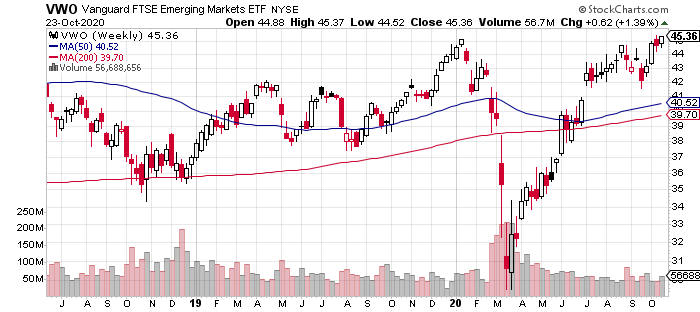
Vanguard FTSE Emerging Markets Shares (NYSE:VWO) led the gainers with a 1.4% increase. The rise lifted VWO to its highest close since early 2018.

Notably, the third-best performer last week was the fixed-income counterpart to VWO. VanEck Vectors J.P. Morgan EM Local Currency Bond (NYSE:EMLC) added 1.1%. The fund is still below its pre-pandemic peak, but the latest rise shows that the ETF has regained most of its coronavirus-crash loss in the spring.
Barron’s notes that:
“after underperforming the US for a decade, emerging markets face an improving backdrop. More fiscal stimulus and a global recovery from the pandemic, along with a weaker dollar that makes foreign assets cheaper for US investors, should help emerging markets over the next year, says Mona Mahajan, strategist at Allianz Global Investors.”
Last week’s biggest loser: US real estate investment trusts (REITs). Vanguard Real Estate Index Fund (NYSE:VNQ) shed 0.6%. The decline marks the fund’s second weekly loss. The fund continues to trading in a range that leaves the ETF well below its pre-pandemic peak.
The Global Markets Index (GMI.F) was fractionally lower last week. This unmanaged benchmark, which holds all the major asset classes (except cash) in market-value weights via ETFs, dipped slightly for a second week.

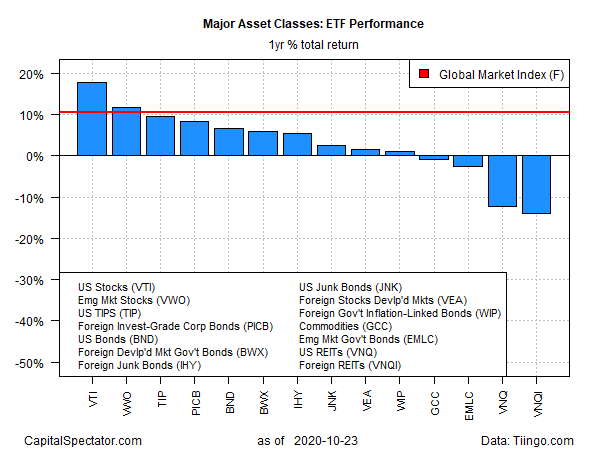
US equities continue to lead for one-year results. Vanguard Total Stock Market Index Fund (NYSE:VTI) is up 18.2% vs. the year-ago level after factoring in distributions. The gain reflects a wide lead over the rest of the field. The second-best one-year performer: emerging markets stocks via VWO, which is up 12.0% over the past 12 months.
Notably, US and foreign property shares are the bottom performers for the one-year window. Vanguard Global ex-U.S. Real Estate Index (NASDAQ:VNQI) is down 14.2% vs. the year-ago price. VNQ is off 12.5% for the past year.
GMI.F is up a solid 10.6% for the trailing one-year period.

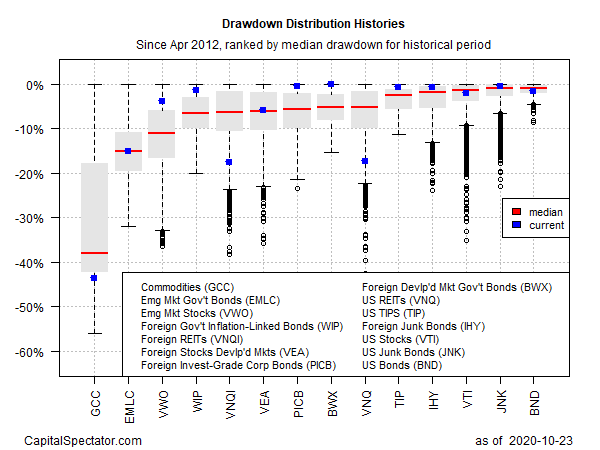
For current drawdown, note that broadly defined commodities (GCC), along with US and foreign real estate shares (VNQ and VNQI) are currently posting relatively steep peak-to-trough declines relative to their median drawdowns since 2012.

