Emerging market bonds have come under pressure along with the rest of the bond market as a sort of Taper 2.0 has hit the market [ECB moving toward taper, BoJ already effectively doing a stealth taper, and the Fed even looking to normalize its balance sheet]. We've talked about ECB/BOJ taper prospects for some time, and noted that the best days of QE (Quantitative Easing) are certainly behind us - at least for this cycle. That means bad news for asset classes that have benefited from QE spillovers and yield chasing. Emerging market bonds are one of those.
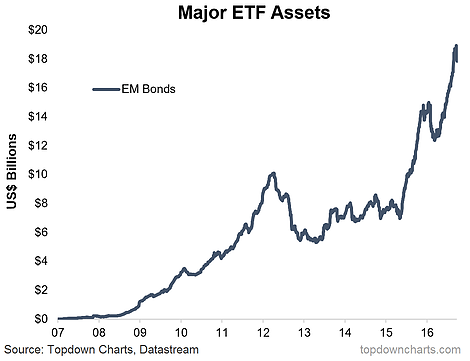
The first chart in this ChartBrief shows Emerging Markets ETF assets and really if you look at the chart you don't really need to add many words.
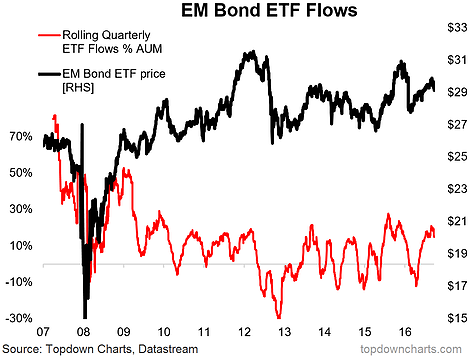
Clearly there has been a boom in EM bond allocations in the ETF space. Some of this surely represents longer term strategic asset allocations or shifts from active to passive management, but if you checkout the next chart you can see there is an ebb and flow in the flows, and arguably our flow indicator is pointing to downside risk. That all said if you look at the distribution yield for a USD EM bond ETF it's around 4.5% (with an average underlying yield of about 5.2%) vs an equivalent US treasuries ETF of around 1.8% (avg yield 2.3%), so there is still a substantial yield pickup. Of course, if price drops then yield will look even better!
The major EM bond ETFs have seen a substantial rise in assets under management over the past 2 years.

Taking a rolling quarterly (price adjusted) flows view (standardized against AUM), the ETF fund flow indicator shows a recent surge, which looks to represent an extreme - and likely contrarian - sentiment signal. Thus it's fair to say on that indicator alone that downside risks are elevated.

