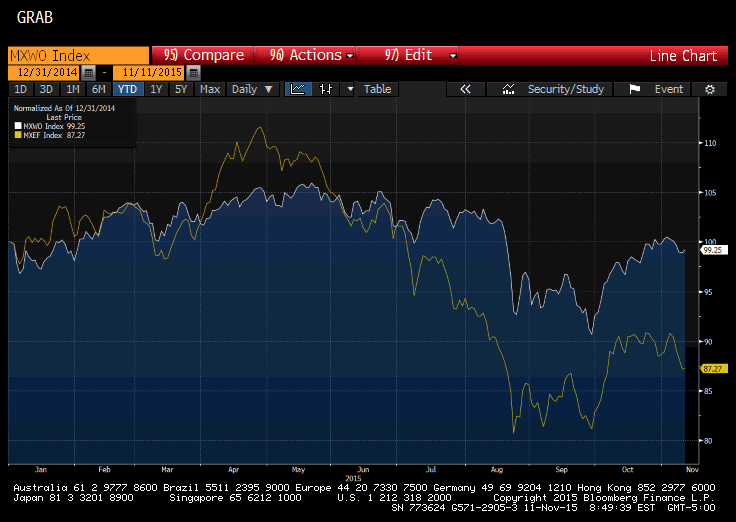
The main divergence we have emphasized is in monetary policy trajectories. The first phase, which began late last year and will run through this month is other countries taking action to ease policy. The Fed stood pat. The second phase is when the Fed lifts rates and many others continue to ease, perhaps at an accelerated rate.
There is another divergence that is taking place. As this Great Graphic, created on Bloomberg shows, the MSCI Emerging Markets equity-market index (N:EEM) (yellow line) is widely under-performing MSCI World (N:URTH), which tracks developed countries' equities (white line). 
As the chart illustrates, in the first quarter, the two were comparable. When it become clear due to the weakness of US Q1 economic data that the Fed was unlikely to raise rates in June, the dollar fell and emerging markets outperformed in April and May. Commodities in general, and oil in particular, rallied then as well. The CRB index peaked in May as did oil. Emerging-market equities unwound the overshoot and by the end of Q2 were actually under-performing the developed equities by a fraction.
Between the end of June and late August, oil fell by a third. The price of copper fell by a quarter from May through August. The Greek political drama and worries about the Chinese economy were also a weight. The reversal of the Chinese stock market also took a toll. From the February low through the June high, the Shanghai Composite rallied 70%. From the June high to the August low, the Shanghai Composite lost 45%, which was sufficient to push it to new lows for the year.
The subsequent stability and recovery in the Shanghai, now more than 25% off its August lows, and the Fed's decision not to hike in September, helped lift the MSCI Emerging market equity index. Alas, the strong US jobs data and the backing up of US rates is once again weighing on emerging equities.
The under performance of emerging-market equities is approaching the extreme seen in mid August. However, the 60-day rolling correlation, conducted on the basis of the percentage change in both MSCI indices has been fairly stable since mid August, a little above 0.7. In the current context, we suspect the extreme divergence may be eased by the developed equities selling off rather than a significant recovery in emerging-market equities.
