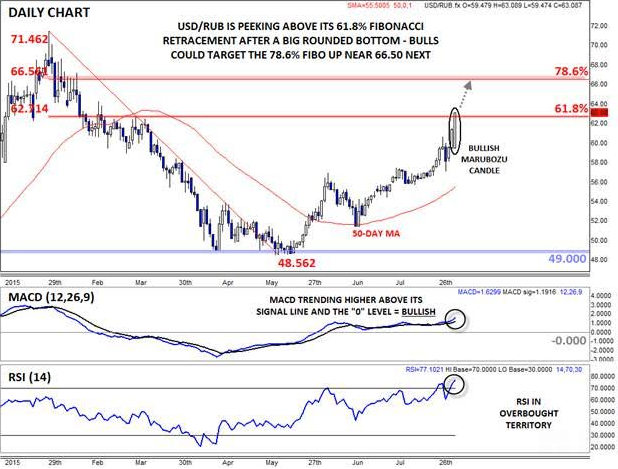
There was a decidedly risk-off tone to the markets on the first Monday of August, with the US dollar and bonds edging higher at the expense of US equities --oil in particular. This same pattern is evident in the less-monitored world of emerging-market currencies, too, where currencies like the Mexican peso, South African rand and Turkish lira are all trading lower against the greenback thus far. As we briefly noted in Monday morning’s report, though, one of the biggest movers in the EM FX world is USD/RUB, which has exploded higher to trade at a new 5-month high near 63 as of writing.
Beyond the obvious impact of falling oil prices -- various forms of petroleum make up a whopping 64% of Russia’s exports -- the ruble is also suffering from Friday’s generally dovish decision by the Central Bank of Russia (CBR). The central bank opted to lob 50bps off its main interest rate, generally in-line with the market’s expectations, though some analysts thought that the committee would remain on hold given the recent weakness in Russia’s currency.
Interestingly, CBR also removed its previous statement that it was “ready to continue cutting” interest rates from its statement, instead noting that “the balance of risks is shifting toward considerable economic cooling”. While this is far from a sign that the current rate-cutting cycle is over, it does suggest that the central bank could adopt a more flexible, data-dependent outlook on economic data and the value of the ruble moving forward. In another example of “signal by omission,” the CBR refrained from threatening further exchange-market intervention to support the ruble, which traders took as a green light to buy USD/RUB en masse.
Technical View
From a technical perspective, USD/RUB formed a large rounded bottom formation over several months and the rally has shifted into high gear over the last week in particular. As of writing, the pair is on track to form a large Bullish Marubozu Candle* on the daily chart, peeking out above the 61.8% Fibonacci retracement at 62.70 in the process. Not surprisingly, the MACD indicator is trending clearly higher, showing strong and growing bullish momentum, though the overbought RSI indicator could argue for some short-term caution.
If we do see USD/RUB close above the 62.70 barrier, a continuation up to the 78.6% Fibonacci retracement at 66.55 could be in play next, especially if oil prices fall further.
* A Marubozu candle is formed when prices open very near to one extreme of the candle and close very near the other extreme. Marubozu candles represent strong momentum in a given direction.

Source: FOREX.com
