
Position unwinding was the main theme overnight as many investors bailed out of long positions in emerging market currencies. The ZAR was the biggest loser, falling some 3% vs USD in one day! AUD and NZD, two of the commodity currencies, fell with them, with NZD/USD hitting a 2013 low. But tellingly, not all the EM currencies fell; some that have been weak recently, such as CZK, did well (+1.2%) as people got out of short positions. The position unwinding benefitted EUR more than USD as many investors were holding these positions against EUR.
It was noticeable overnight that jobless claims were higher than expected, which sent Treasury yields lower, which helped to support equities. So we have gone from last week’s positive correlation between stocks and bonds, when good economic news sent both stocks and bond yields higher, to a negative “bad news is good news” correlation, where bad economic news that implies no change in QE means bond yields lower and stock prices higher. It remains to be seen how long we will stay in this regime as the market considers the implications of a “tapering off” by the Fed, compounded by the troubles that Japan is having with its QE program. It’s also not clear what this state implies for the dollar; recently, risk on has meant buy USD, but that may not continue if the driver behind risk appetite is hopes for continued QE.
Eurozone CPI and unemployment are the big figures of the day. The market is looking for an acceleration in headline inflation in May (to 1.4% from 1.2% in April) and yet another small rise in unemployment in April (12.2% from 12.1%). The rise in inflation reduces the necessity for the ECB to cut rates or extend extraordinary measures at its meeting next week so could be EUR-positive. The UK money supply data is expected to show a modest improvement in real estate lending, but the general trend is sideways. In the US, personal income is expected to have risen 0.1% mom in April, down a bit from 0.2 in March, while personal spending is forecast to be unchanged month-on-month, vs +0.2% in March. The personal consumption expenditure deflator (PCE), the Fed’s favourite inflation indicator, is expected to be down 0.2% mom vs -0.1% in March. So far though such a low level of inflation has not raised alarms with the Fed. The Chicago Purchasing managerTs index is forecast to be right on the boom-or-bust line of 50.0, vs 49.0 in April.
EUR/USD 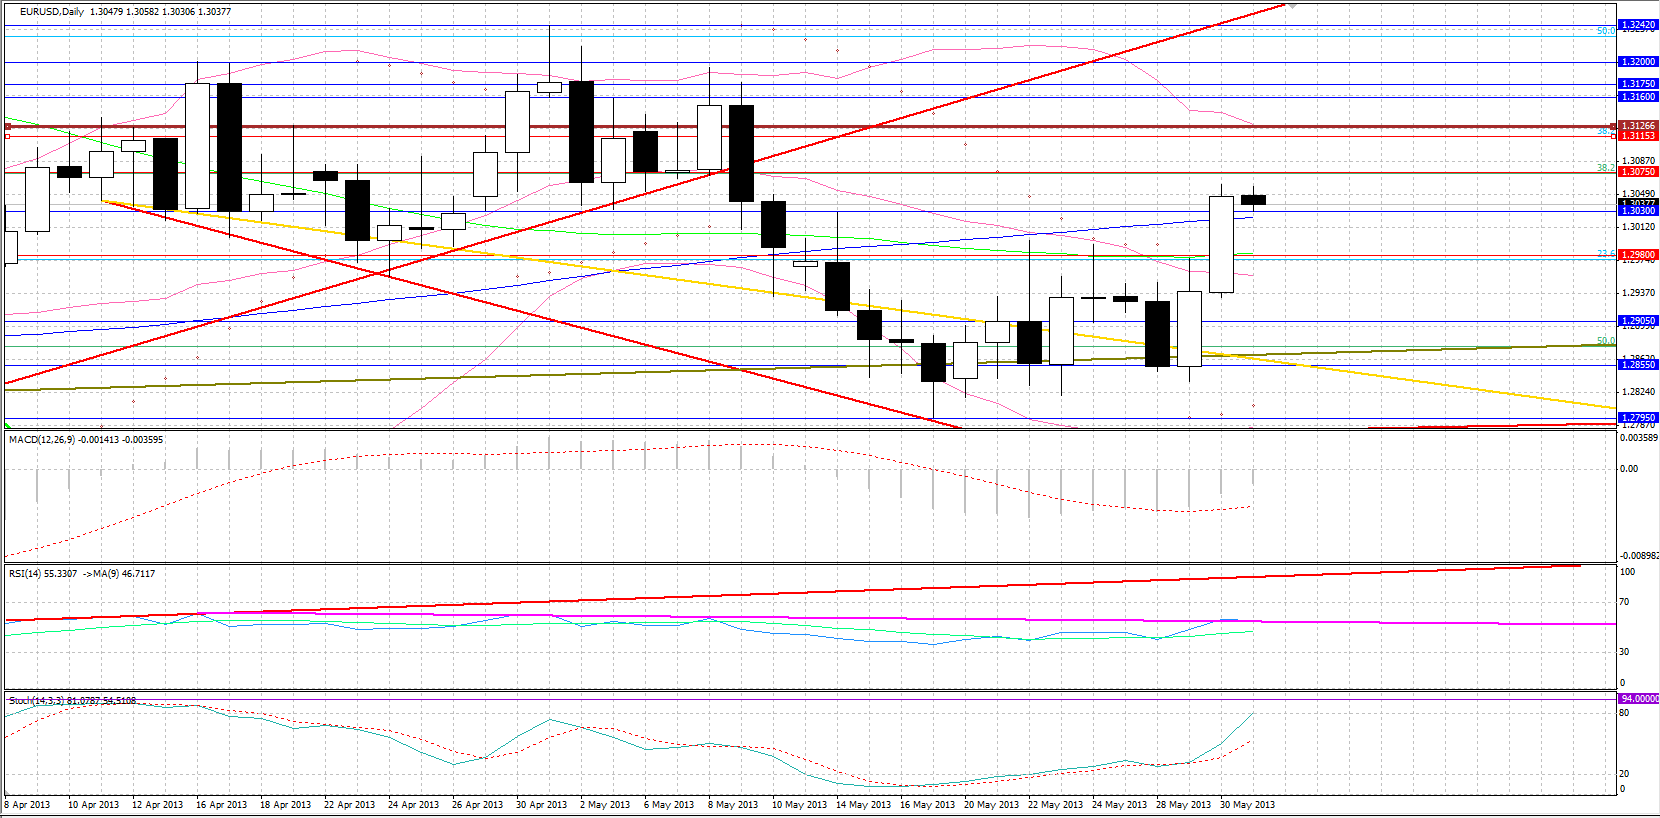 EUR/USD" title="EUR/USD" width="1660" height="818">
• EUR/USD continued higher after breaking above the 1.3000 key level. New resistance now lies at 1.3075 and 1.3130 in extension, a level where we find a previous high, and the top Bollinger bands level. The pair as at the point of writing is at 1.3030 being supported by this former resistance point and its 200 days moving average. If this support does not hold then we may see the pair drop towards 1.2980 and 1.2900 if lower.
USD/JPY 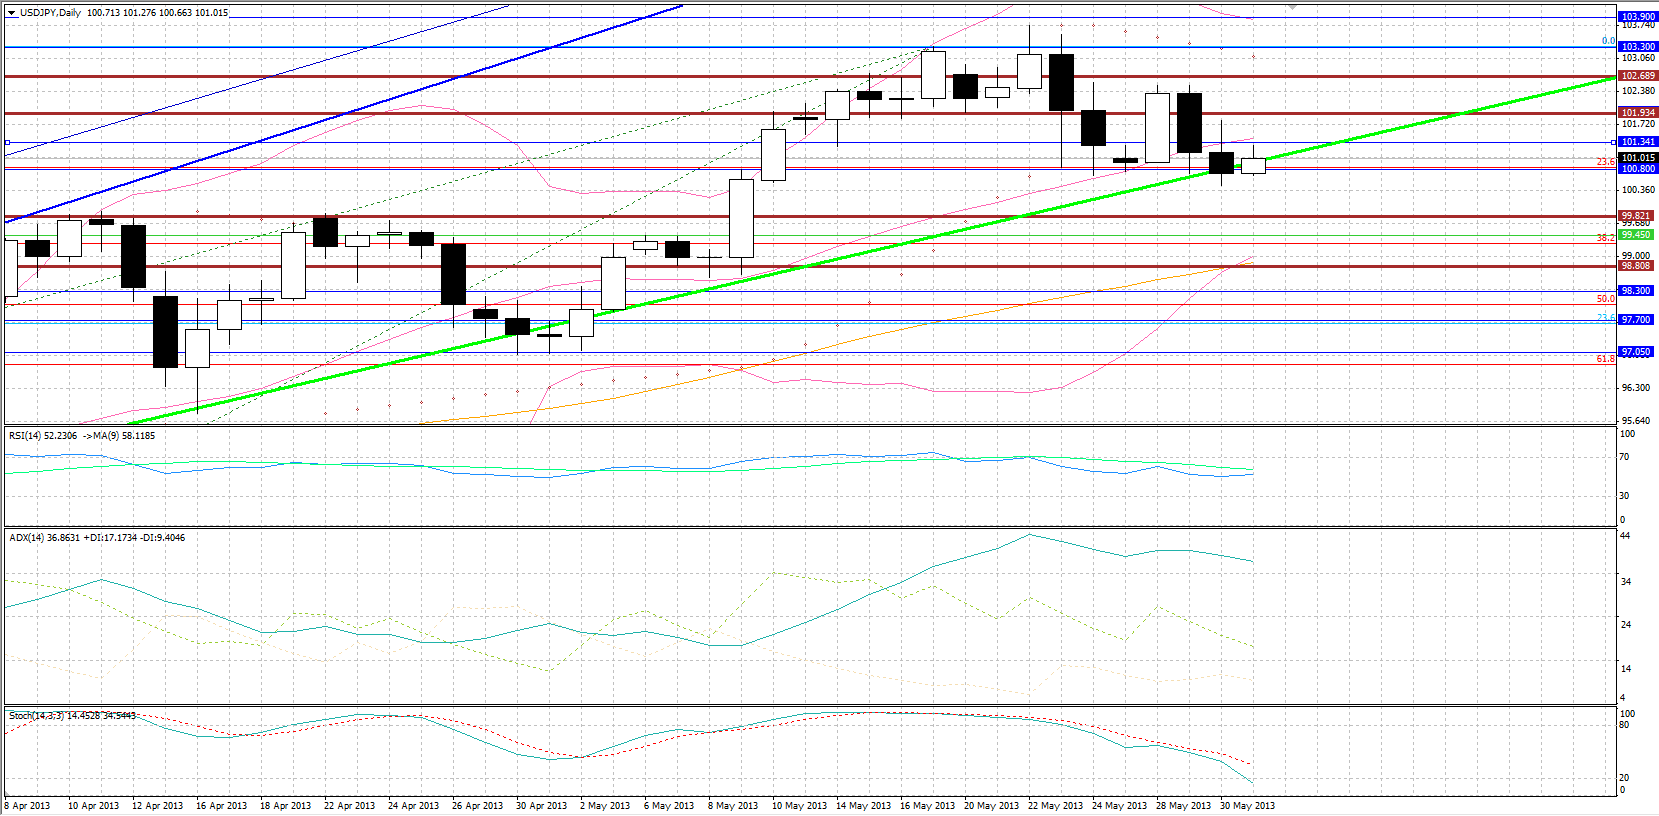 USD/JPY" title="USD/JPY" width="1659" height="816">
• USD/JPY dropped further yesterday. Nevertheless for another session it was unable to break below 100.80 and is testing this level this morning. A breakout of this support could lead towards 99.80 and even 98.80 if we wait a bit longer. Resistance to the upside remains 102.00 and 102.70 again. Some weaker intermediate resistance is to be found at 101.35, the 20 day moving average
NZD/USD 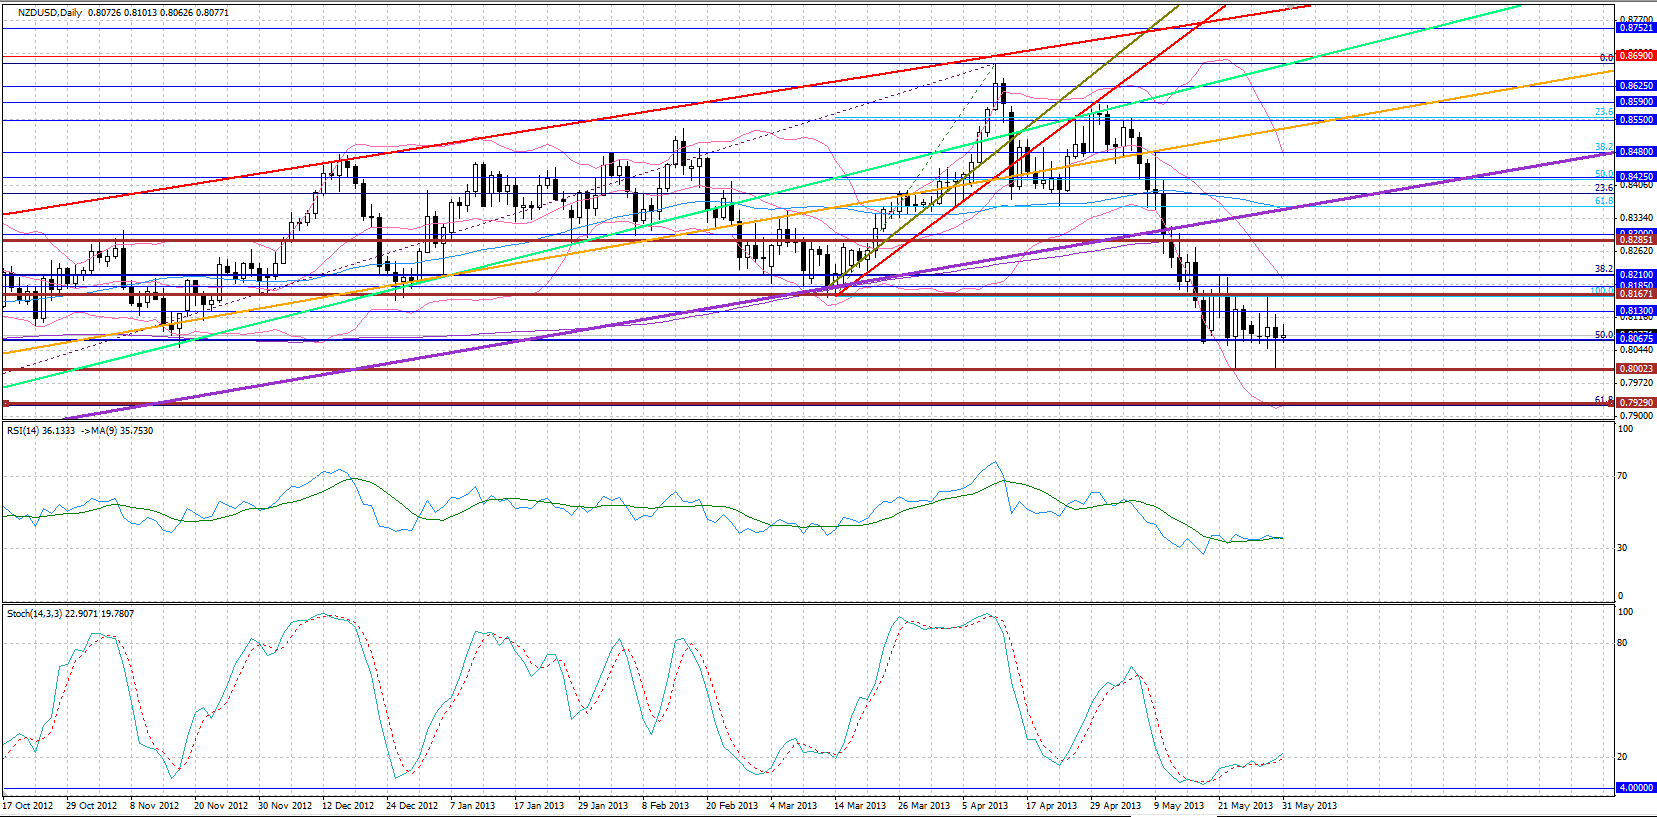 NZD/USD" title="NZD/USD" width="1657" height="817">
• NZD/USD suffered major loses yesterday, reaching very near the 0.8000 psychological level. Over the past 10 sessions we have seen the pair finish the day near the 0.8060 area and yesterday was no exception. The 0.8000 is a 1 year low and if broken today, the pair should hit 0.7930. Resistance to the upside comes at 0.8170 and 0.8285 in extension.
Gold
• The lower dollar and higher jobless claims helped gold to break out of its trading range after breaking above the key $1400 resistance level and moved substantially higher. $1430 is now the next resistance to follow with the next one being at $1475, a previous peak and top Bollinger bands level. Support levels are now the $1400 psychological level followed by $1370.
Oil
• WTI was a gainer yesterday on technicals after the $92.30 support level held and bounced higher. WTI found resistance and this morning is at $93.50, a previous support level that has turned resistance now. If the up move continues, resistance is the $95.00 level followed by $96.00. Support remains at $92.30, while the next level can be found at $90.60.
BENCHMARK CURRENCY RATES - DAILY GAINERS AND LOSERS
MARKETS SUMMARY
- English (UK)
- English (India)
- English (Canada)
- English (Australia)
- English (South Africa)
- English (Philippines)
- English (Nigeria)
- Deutsch
- Español (España)
- Español (México)
- Français
- Italiano
- Nederlands
- Português (Portugal)
- Polski
- Português (Brasil)
- Русский
- Türkçe
- العربية
- Ελληνικά
- Svenska
- Suomi
- עברית
- 日本語
- 한국어
- 简体中文
- 繁體中文
- Bahasa Indonesia
- Bahasa Melayu
- ไทย
- Tiếng Việt
- हिंदी
EM Position Unwind Sends EUR/USD Higher
Published 05/31/2013, 03:14 AM
Updated 07/09/2023, 06:31 AM
EM Position Unwind Sends EUR/USD Higher
Latest comments
Loading next article…
Install Our App
Risk Disclosure: Trading in financial instruments and/or cryptocurrencies involves high risks including the risk of losing some, or all, of your investment amount, and may not be suitable for all investors. Prices of cryptocurrencies are extremely volatile and may be affected by external factors such as financial, regulatory or political events. Trading on margin increases the financial risks.
Before deciding to trade in financial instrument or cryptocurrencies you should be fully informed of the risks and costs associated with trading the financial markets, carefully consider your investment objectives, level of experience, and risk appetite, and seek professional advice where needed.
Fusion Media would like to remind you that the data contained in this website is not necessarily real-time nor accurate. The data and prices on the website are not necessarily provided by any market or exchange, but may be provided by market makers, and so prices may not be accurate and may differ from the actual price at any given market, meaning prices are indicative and not appropriate for trading purposes. Fusion Media and any provider of the data contained in this website will not accept liability for any loss or damage as a result of your trading, or your reliance on the information contained within this website.
It is prohibited to use, store, reproduce, display, modify, transmit or distribute the data contained in this website without the explicit prior written permission of Fusion Media and/or the data provider. All intellectual property rights are reserved by the providers and/or the exchange providing the data contained in this website.
Fusion Media may be compensated by the advertisers that appear on the website, based on your interaction with the advertisements or advertisers.
© 2007-2024 - Fusion Media Limited. All Rights Reserved.