Today we will talk about cryptocurrencies in which we see some interesting bullish developments.
Bitcoin is the first, the strongest and the best cryptocurrency, so it still should be a leader in the Crypto market. Of course, we are tracking many BTC/USD charts from different exchanges, but the most accurate was and will always be BTC Futures chart.
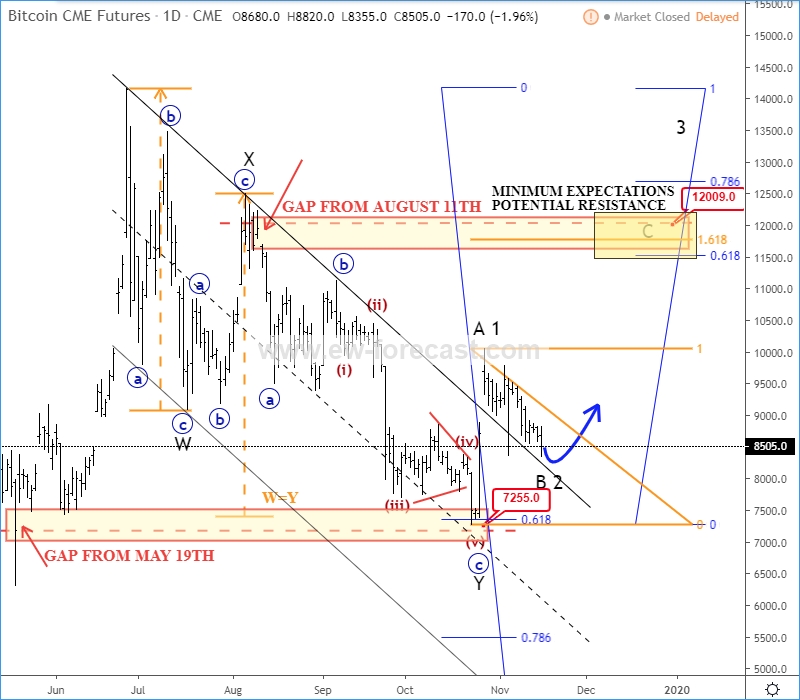
BTC CME FUTURES, Daily

Well, after that deeper W-X-Y corrective decline since the end of June down to ideal, very important 61,8% Fibonacci and May 19th GAP support area, we have seen a strong bounce at the end of October back above channel resistance line, which could be a signal for a bullish turn and recovery at least in three waves A/1-B/2-C/3. As you can see, seems like wave C/3 is still missing and may occur soon. Why wave C/3? Because we are always looking for minimum expectations, just in case if there will be something more sideways and complex. So, our first potential resistance for wave C would be again around ideal 61,8% Fibonacci area, especially because of another opened GAP on August 11th, which comes exactly around 12000 area. And in case, if we see an impulsive continuation even higher towards new highs, then even better and we can start tracking wave 3, so in our opinion it's worth to try some longs with stops at 7255 level.
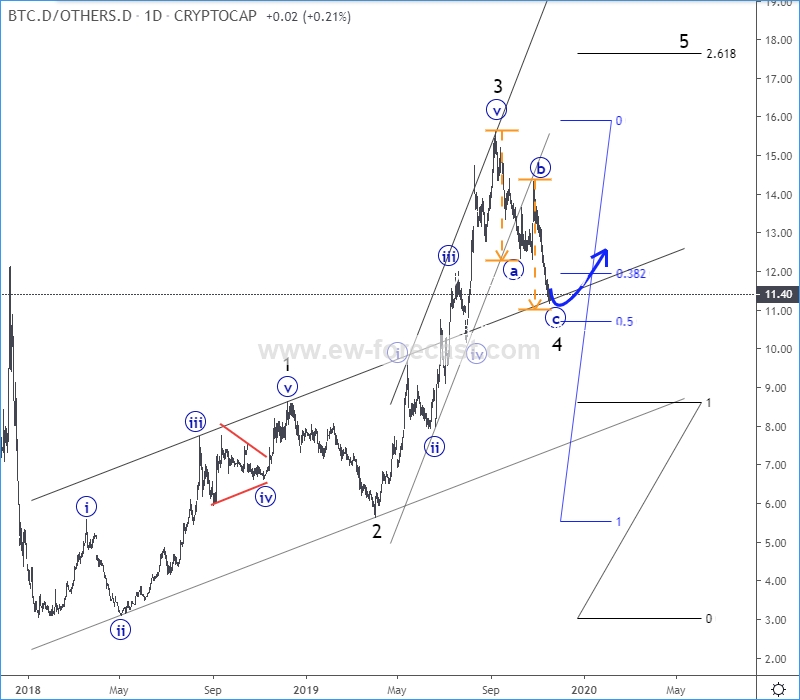
BTC.D/OTHERS.D, Daily

The main reason we are expecting a recovery and why BITCOIN still can outperform ALTcoins in the Crypto market is definitely BTC Dominance against the ALT Dominance (BTC.D/OTHERS.D) ratio chart.
As you can see, BTC is dominating already since the beginning of 2018 and it can be unfolding a five-wave bullish cycle, which seems to be unfinished. So, after that three-wave a-b-c corrective decline from the highs, we still think it's just a temporary lost of BTC Dominance, ideally in wave 4, so sooner or later we will expect a reversal back to highs for wave 5.
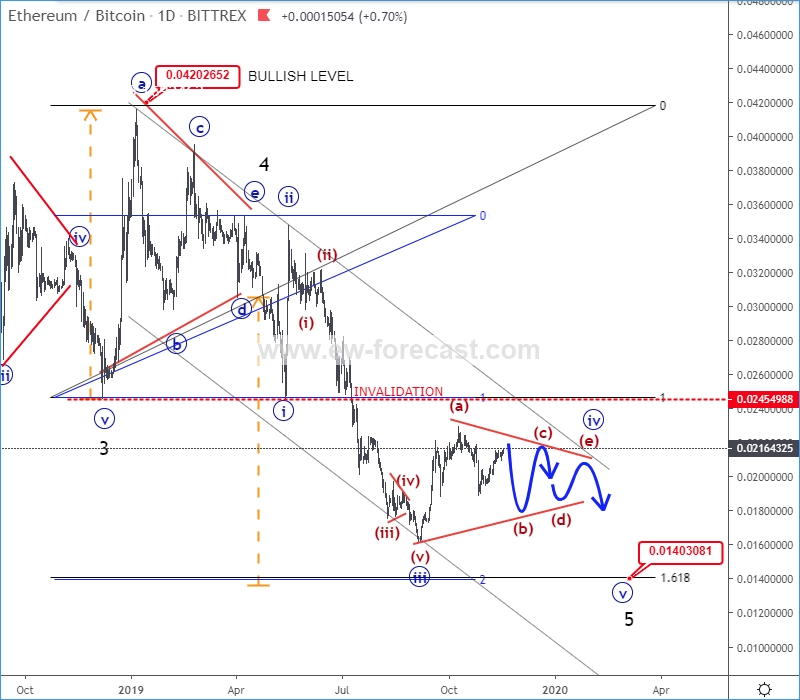
ETH/BTC, Daily

What this all actually means? Well, as said above, Crypto market can see some green days/weeks, especially BITCOIN because of its dominance. However, even some ALTcoins may see a recovery, but only against the USD and in a slower pace than BTC/USD. Why we are saying this is because many traders are also looking at the XXX/BTC cross pairs and if we consider that BTC dominance might be back in the game, then XXX/BTC crosses may stay under bearish pressure. For example we decided to show you ETH/BTC chart, in which we still see room for more weakness, so ideally it's in a wave 4 correction (maybe a triangle) just like BTC.D/OTHERS.D chart that can send the price back to lows for wave 5 towards projected 0.014 target area and something similar may occur with many other XXX/BTC Crypto pairs, so carefully with these ones.
Disclosure: Please be informed that the information we provide is NOT a trading recommendation or investment advice. All of our work is for educational purposes only.
