NVDA Q3 Earnings Alert: Why our AI stock picker is still holding Nvidia stockRead More

Elliott Wave Correction Approaching In EUR/JPY

Published 05/28/2020, 06:00 AM
Updated 07/09/2023, 06:31 AM
EUR/USD
-
EUR/JPY
-

The euro has been declining against its Japanese counterpart for years. Most recently, it fell to 114.43 on May 6th. However, a recovery has been in progress for the past three weeks. Earlier today, EURJPY reached a high of 118.96, up over 450 pips from the bottom.

Can the rally continue and is the current level of ~118.60 appropriate for more bulls to join? These are the question we hope to answer with the help of the Elliott Wave principle. The chart below allows us to examine the structure of the recent rally.
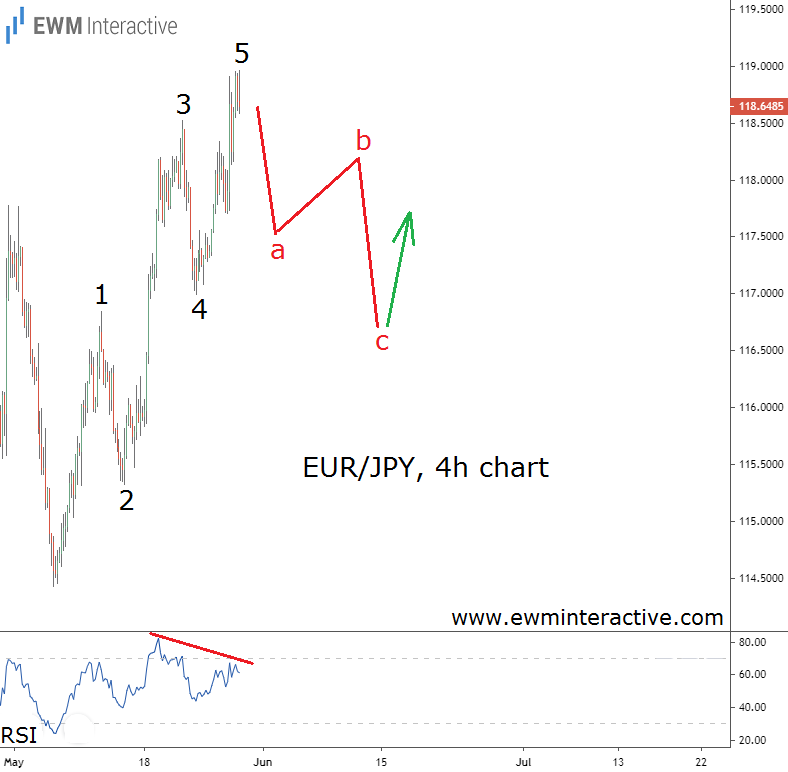
EUR/JPY 240 Hour Chart

As visible, EURJPY’s surge looks like a textbook five-wave impulse pattern, labeled 1-2-3-4-5. Wave 4 came very close to the top of wave 1, but stayed above it nonetheless, not violating the rules. According to the theory, a three-wave correction follows every impulse.

So, if this count is correct, we can expect a decline to roughly the support area of wave 4. This means EURJPY can drop to 117.00 or slightly lower before the bulls return. Another reason not to go long right away is the bearish RSI divergence between waves 3 and 5. Much better buying opportunities should present themselves near the lows of wave ‘c’ of the anticipated correction.

Original Post

Latest comments

Loading next article…
Risk Disclosure: Trading in financial instruments and/or cryptocurrencies involves high risks including the risk of losing some, or all, of your investment amount, and may not be suitable for all investors. Prices of cryptocurrencies are extremely volatile and may be affected by external factors such as financial, regulatory or political events. Trading on margin increases the financial risks.
Before deciding to trade in financial instrument or cryptocurrencies you should be fully informed of the risks and costs associated with trading the financial markets, carefully consider your investment objectives, level of experience, and risk appetite, and seek professional advice where needed.
Fusion Media would like to remind you that the data contained in this website is not necessarily real-time nor accurate. The data and prices on the website are not necessarily provided by any market or exchange, but may be provided by market makers, and so prices may not be accurate and may differ from the actual price at any given market, meaning prices are indicative and not appropriate for trading purposes. Fusion Media and any provider of the data contained in this website will not accept liability for any loss or damage as a result of your trading, or your reliance on the information contained within this website.
It is prohibited to use, store, reproduce, display, modify, transmit or distribute the data contained in this website without the explicit prior written permission of Fusion Media and/or the data provider. All intellectual property rights are reserved by the providers and/or the exchange providing the data contained in this website.
Fusion Media may be compensated by the advertisers that appear on the website, based on your interaction with the advertisements or advertisers.
© 2007-2024 - Fusion Media Limited. All Rights Reserved.