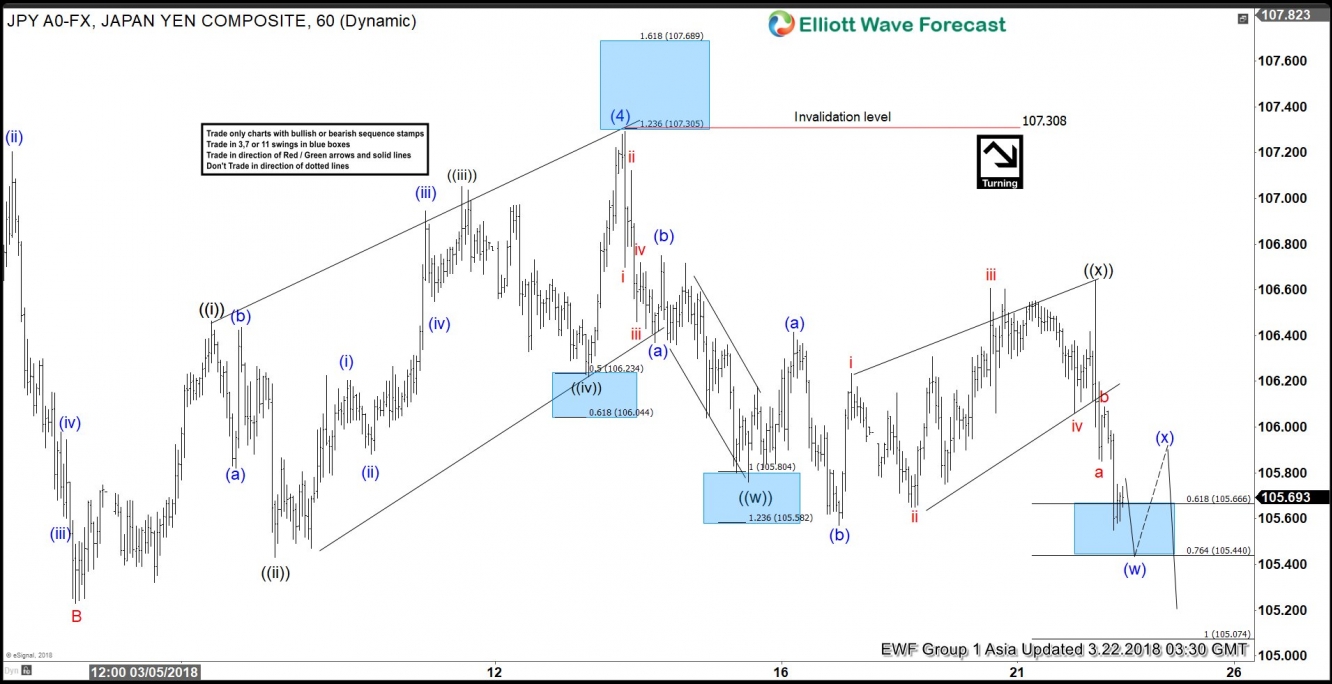
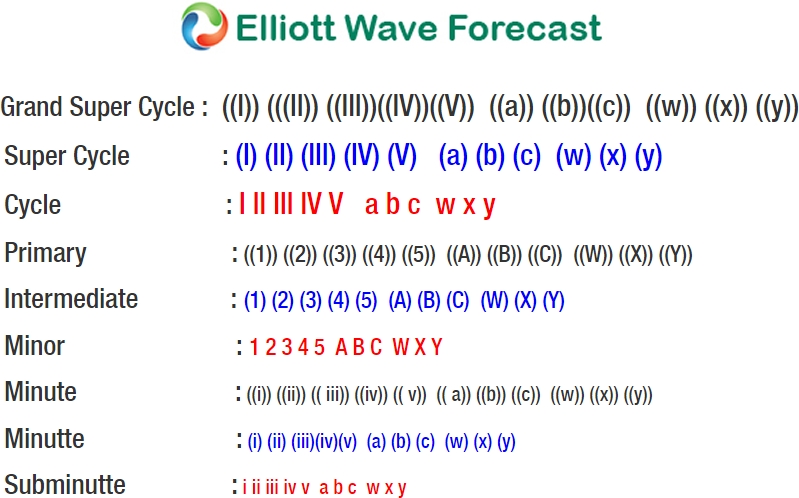
USD/JPY Elliott Wave view suggests that the decline from 11.6.2017 high is unfolding as a 5 waves impulse Elliott Wave structure. Down from 11.6.2017 high (114.73), Intermediate wave (1) ended at 110.84, Intermediate wave (2) ended at 113.75, Intermediate wave (3) ended at 105.55, and Intermediate wave (4) ended at 107.3. Intermediate wave (5) is in progress as an Ending Diagonal Elliott Wave structure.
Down from 107.3, Minute wave ((w)) ended at 105.76 and Minute wave ((x)) ended at 106.64. Subdivision of Minute wave ((w)) unfolded as a zigzag Elliott Wave structure where Minutte wave (a) ended at 106.37, Minutte wave (b) ended at 106.75, and Minutte wave (c) of ((w)) ended at 105.76. Subdivision of Minute wave ((x)) unfolded as an Expanded Flat Elliott Wave structure where Minutte wave (a) ended at 106.41, Minutte wave (b) ended at 105.57, and Minutte wave (c) of ((x)) ended at 106.64. Near term, expect pair to bounce in Minutte wave (x) to correct cycle from 106.64 high, then as far as pivot at 3.13.2018 high (107.3) stays intact, expect pair to extend lower towards 104 area.
USD/JPY 1 Hour Elliott Wave Chart


