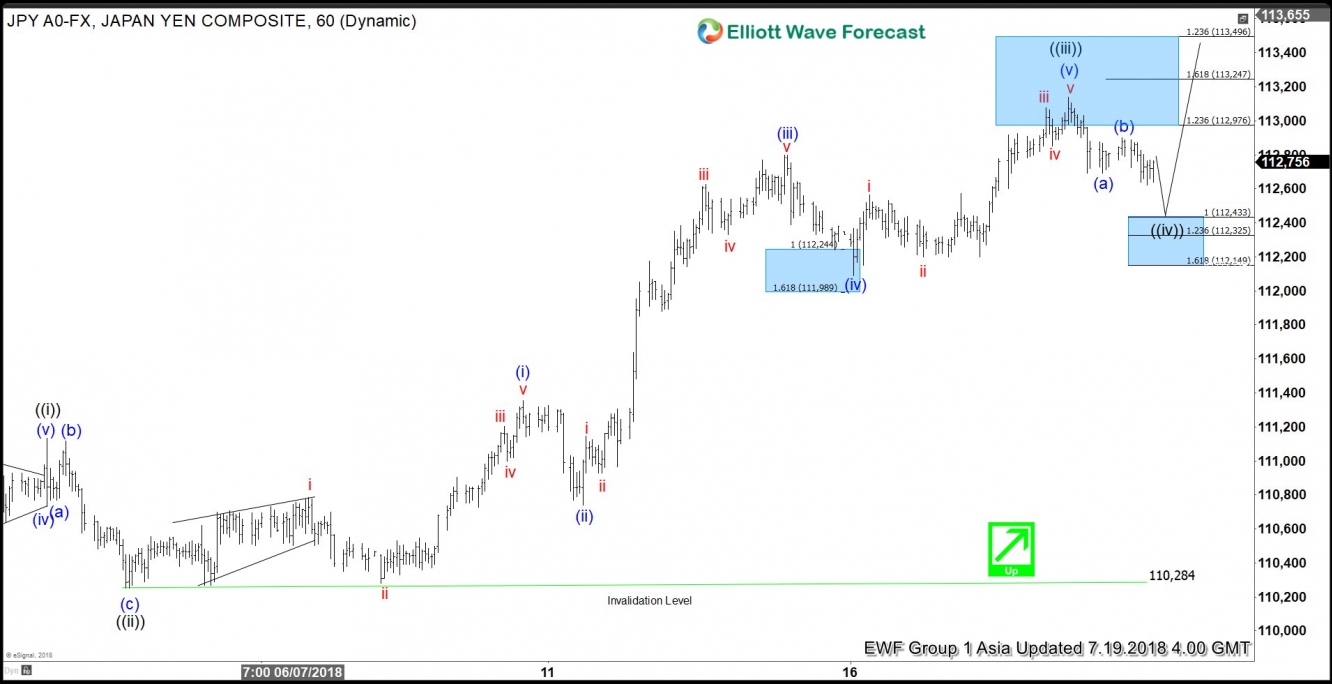
USD/JPY short-term Elliott Wave analysis suggests that the pullback to 110.28 low ended Minute wave ((ii)) pullback. The internals of that pullback unfolded as Elliott wave Flat structure where Minutte wave (a) ended at 110.77. Up from there, bounce to 111.11 ended Minutte wave (b), and Minutte wave (c) of ((ii)) ended in 5 waves at 110.28 low.
The pair has since rallied within Minute wave (((iii)) rally as an Elliott wave impulse structure. Up from 110.28, the rally to 111.35 high ended Minutte wave (i) of ((iii)) as 5 waves. Afterwards, the pullback to 110.74 low ended Minutte (ii) of ((iii)), and pair rallied again in another 5 waves within Minutte wave (iii) of ((iii)) which ended at 112.8. Down from there the pullback to 112.09 low ended Minute wave (iv) of ((iii)), and the last leg Minutte wave (v) of ((iii)) is proposed complete at 113.38. Minute wave ((iv)) pullback is currently in progress in 3, 7, or 11 swings to correct the cycle from 7/4 low (110.28) before pair resumes the rally higher. We don’t like selling the pair.
USD/JPY 1 Hour Elliott Wave Chart


