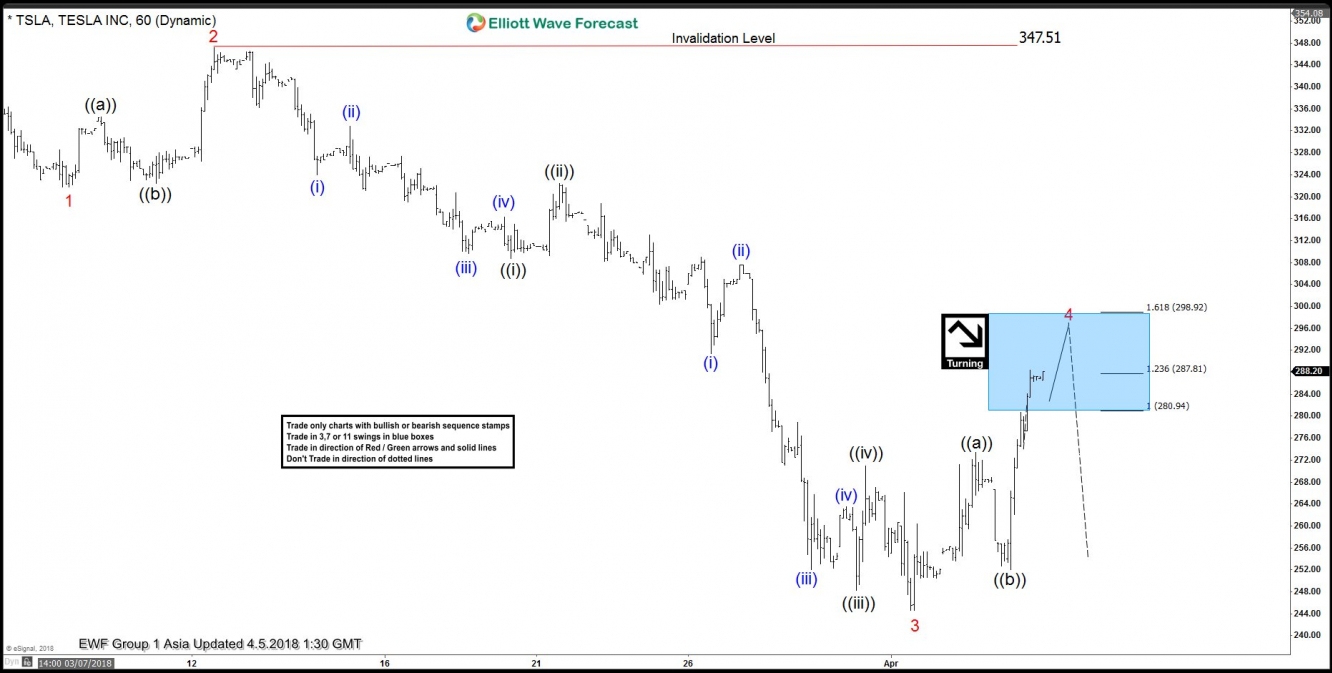
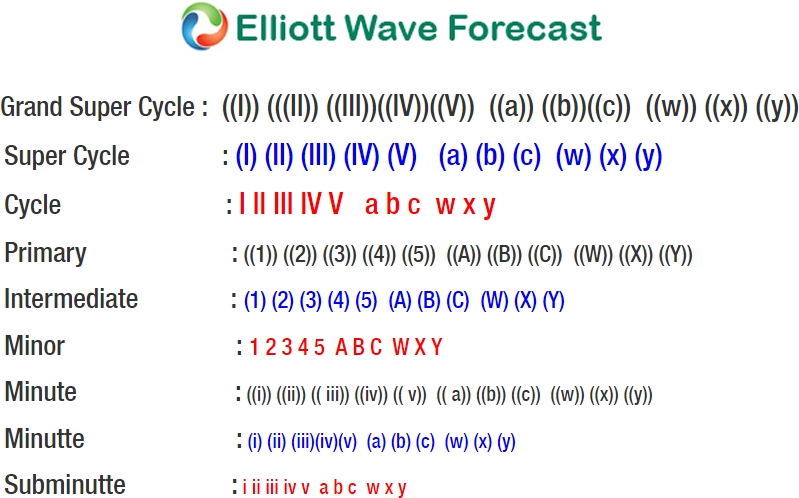
Latest Elliott Wave view in Tesla (NASDAQ:TSLA) suggests that the decline from 2.27.2018 ($359.99) is unfolding as an impulse Elliott Wave structure. Down from 2.27.2018 high, Minor wave 1 ended at $322.97, Minor wave 2 ended at 347.21, and Minor wave 3 ended at $244.59. Minor wave 3 has an extension and also have 5 waves impulsive subdivision. Minute wave ((i)) of 3 ended at $308.76, Minute wave ((ii)) of 3 ended at $322.44, Minute wave ((iii)) of 3 ended at $248.21, Minute wave ((iv)) of 3 ended at $270.96, and Minute wave ((v)) of 3 ended at $244.59.
Minor wave 4 is currently in progress as a zigzag Elliott Wave structure where Minute wave ((a)) ended at $273.35 and Minute wave ((b)) ended at 252. The stock has reached 100% area where Minute wave ((c)) of 4 could complete. It could see sellers at $287.81 – $298.92 area for more downside or at least a 3 waves pullback.
Tesla Elliott Wave 1 Hour Chart
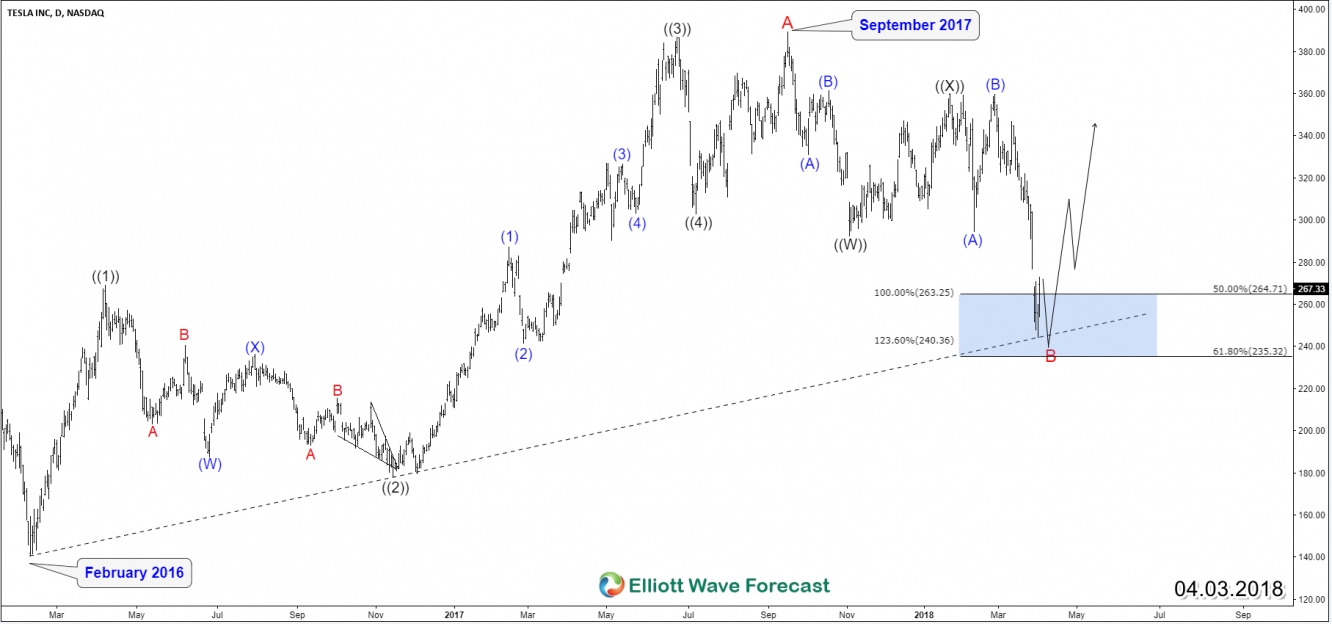
Tesla Elliott Wave Daily Chart
In the larger time frame Daily Chart, Tesla has reached 100% from September 2017 peak thus it has reached the minimum target and does not need to make a new low. It could see a new leg higher from $235.32 – $264.71 that will bring it to new high or at least does a larger 3 waves bounce to correct cycle from September 2017 peak.


