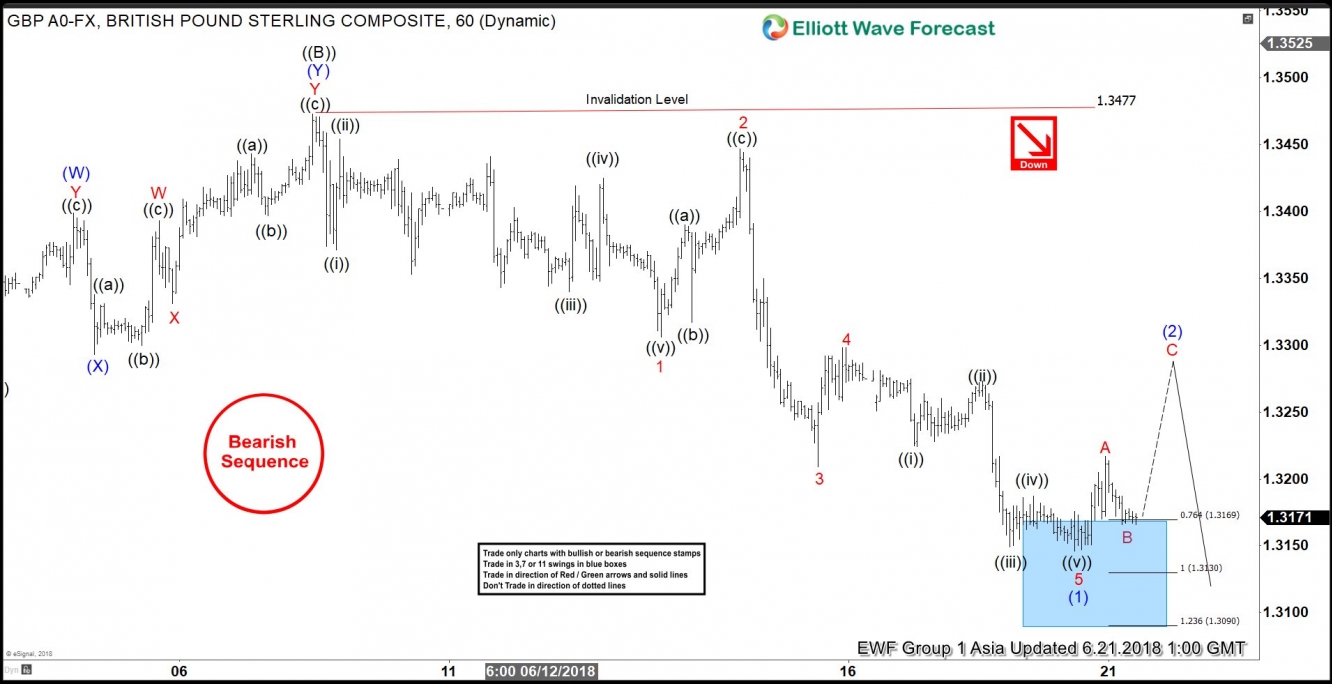
GBP/USD short-term Elliott Wave view suggests that the recovery to 1.3473 on 6/07/2018 peak ended primary wave ((B)) bounce as double three structure. Below from there, the pair has managed to break below the previous low on 5/29 (1.3203) to confirm the next extension lower in primary wave ((C)) has started. With this break lower, the sequence from 4/17/2018 peak has become incomplete to the downside.
Down from 1.3473 high, intermediate wave (1) unfolded as an impulse structure with lesser degree sub-division showing 5 waves structure in Minor wave 1, 3 & 5. The internals of Minor wave 1 ended in 5 waves at 1.3306. The Minor wave 2 bounce ended at 1.3447. Then Minor wave 3 ended in another 5 waves at 1.3209. Minor wave 4 ended at 1.3298 & Minor wave 5 of (1) is proposed complete in 5 waves at 1.3146 low.
Above from there, pair could have started intermediate wave (2) recovery in 3, 7 or 11 swings. However, pair needs to make further separation from the lows to validate this view. If pair breaks below 1.3146 low instead, then it is still in the process of ending Minor wave 5 lower. Near-term, while pullbacks stay above from 1.3146 low, the pair is expected to do a bounce higher in intermediate wave (2). The it should find sellers in 3, 7 or 11 swings for further downside extension in the pair. We don’t like buying the pair in the proposed bounce. And expect sellers to appear in any rally in 3, 7, 11 swing for extension lower in the pair.
GBP/USD 1 Hour Elliott Wave Chart


