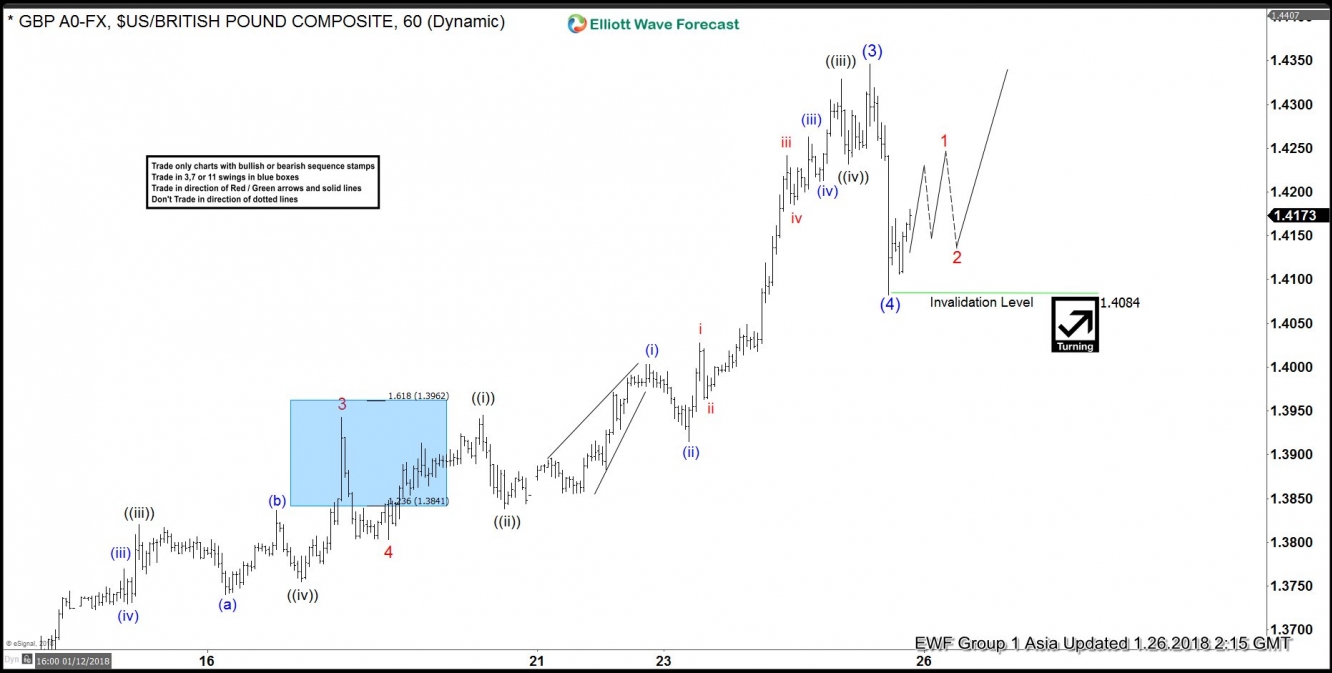
GBP/USD Short Term Elliott Wave view suggests that pair ended Intermediate wave (2) at 1.33 on 16 December 2017. Up from there, Intermediate wave (3) rally is unfolding as 5 waves impulse Elliott Wave structure where Minor wave 1 ended at 1.3613, Minor wave 2 ended at 1.3456, Minor wave 3 ended at 1.3943, Minor wave 4 ended at 1.3797, and Minor wave 5 of (3) ended at 1.434.
Pullback to 1.4084 today is proposed to have ended Intermediate wave (4) at 1.4084, but pair still needs to break above Intermediate wave (3) at 1.434 to confirm this view. Until then, a double correction in Intermediate wave (4) still can't be ruled out. Near term, while pullbacks stay above 1.4084, but more importantly as far as pivot at 16 December 2017 low (1.33) stays intact, expect pair to extend higher. We don't like selling the pair.
GBP/USD 1 Hour Elliott Wave Chart


