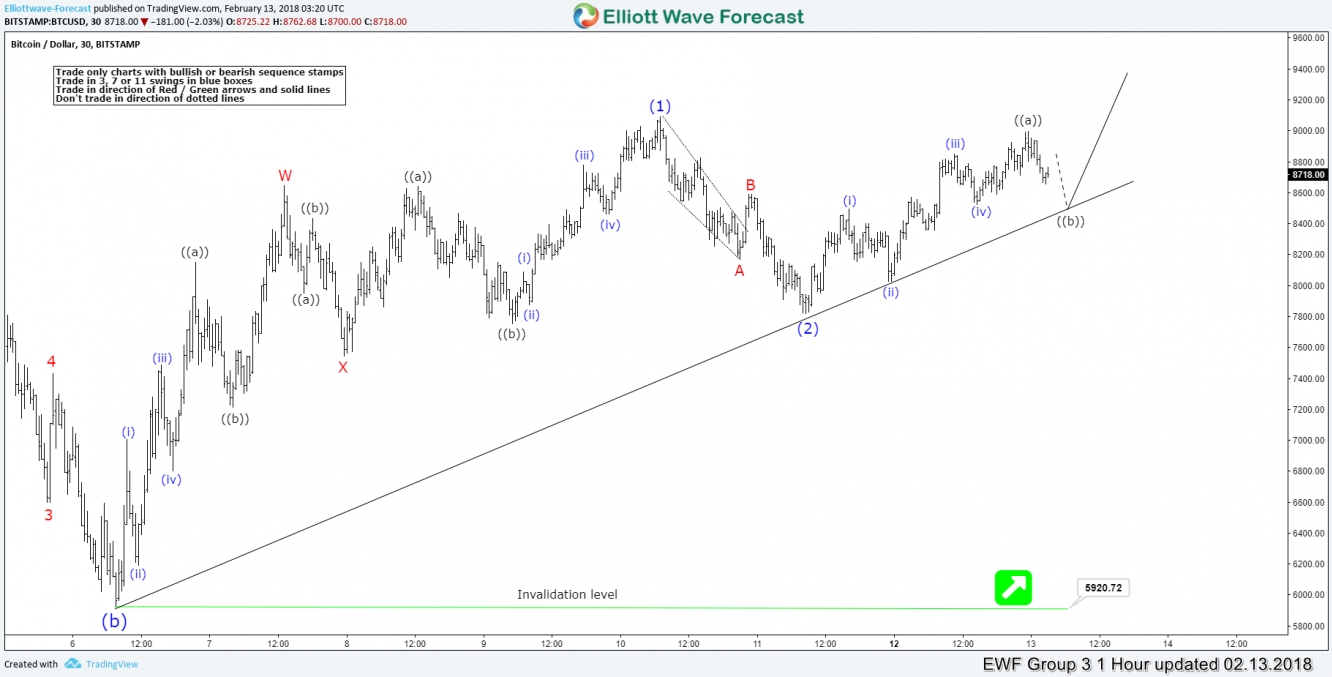
Bitcoin ticker symbol: (BTCUSD ) Short Term Elliott Wave view suggests that the decline from December 17.2017 peak to February 05.2018 low (5920.72) ended the Super Cycle wave “(b)” lower. Above from there, the rally is unfolding as a leading diagonal Elliott Wave structure. Where Intermediate wave (1) ended at 9090.8 high as Elliott Wave Double three structure. Where internals of Intermediate wave (1) ended in Minor wave W at 8648.9 high and Minor wave X at 7543.3 low.
Below from 9090.8 high, the pair ended it’s short-term correction against 2/05 cycle in Intermediate wave (2) low at yesterday’s low 7820. The internals of Intermediate wave (2) unfolded as Elliott Wave Zigzag correction, where Minor wave A ended at 8170.9 and Minor wave B ended at 8589.1 high. Above from there, the pair is expected to resume the upside. However, a break of 9090.8 high remains to be seen to avoid the double correction lower in Intermediate wave (2) dip. Up from 9090.8 low, the rally is unfolding as Zigzag Elliott wave structure. Where Minute wave ((a)) ended in 5 waves at 8992.9 high, below from there, the pair is doing a short-term correction against 7820 low in 3, 7 or 11 swings within Minute wave ((b)) dip. Near-term, while dips remain above 7820 low and more importantly the pivot from 5920.72 low remains intact during the dips pair is expected to resume higher. We don’t like selling it into a proposed pullback.
BTC/USD 1 Hour Elliott Wave Chart


