
A month and a half ago, Moodys (NYSE:MCO) was trading below $137 a share, following a decline from as high as $188 in late-July, 2018. MCO stock was down by 27% in just five months and investors were getting overly pessimistic about its investment merits.
But instead of simply extrapolating the recent weakness into the future, we decided to examine MCO stock through an Elliott Wave perspective. The chart below, published in an article on December 21st, summed up our findings.
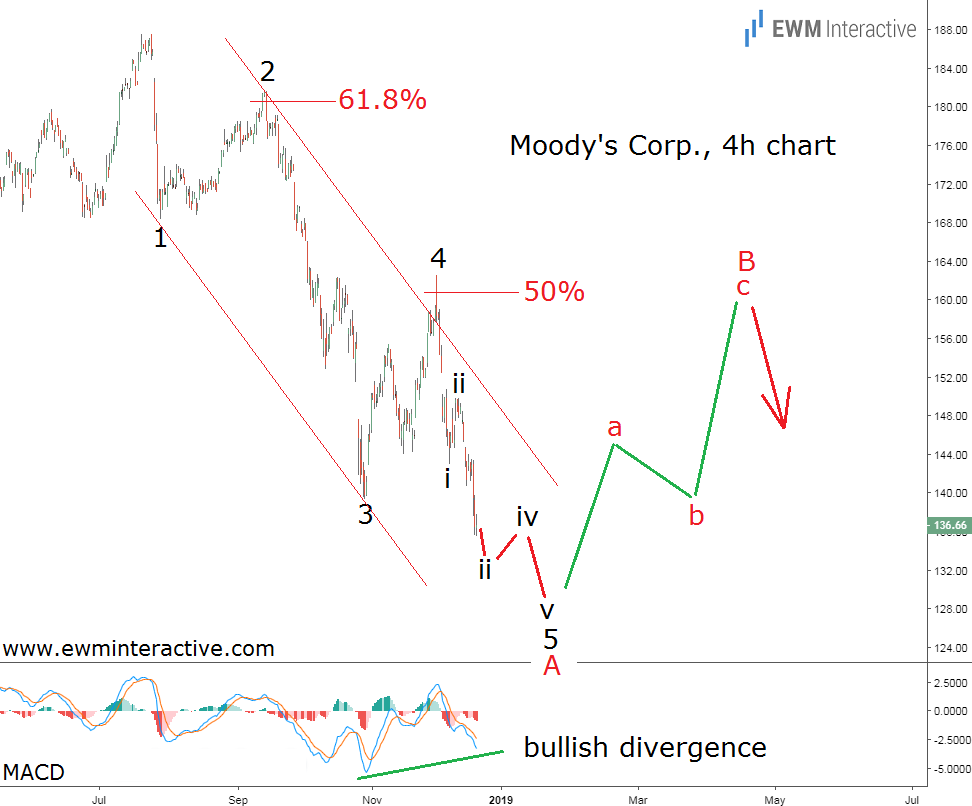
Moody’s’ 4-hour chart revealed that a perfect impulsive decline has been in progress since the high of $188. The Elliott Wave theory postulates that a three-wave correction in the opposite direction follows every impulse pattern. Hence, instead of joining the bears, we though MCO stock was poised for a bullish reversal near $130.
In addition, the MACD indicator revealed a bullish divergence between waves 3 and 5 of A. The anticipated recovery was supposed to reach the resistance area of wave 4 near $160, since there were no other major obstacles prior to this level.
MCO Stock Elliott Wave Update
Last week, MCO stock closed at $161.27, so it is time to take another look at the situation on the updated chart below.
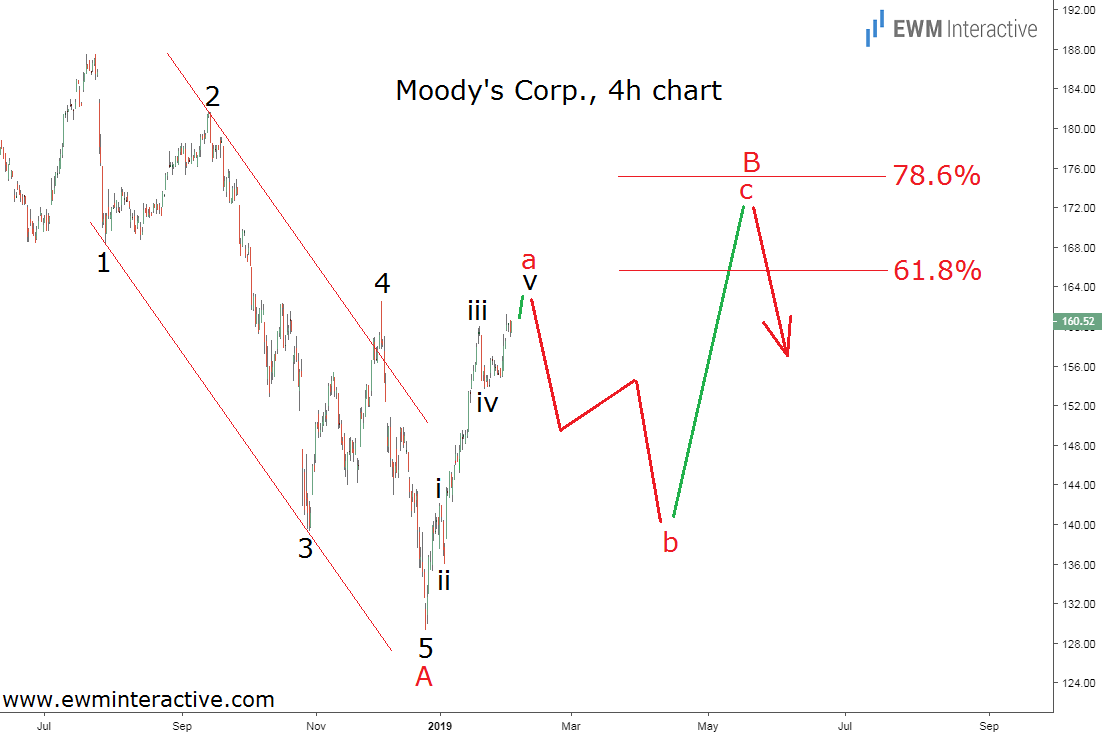
So far so good. The Wave principle successfully warned us about a price reversal, just when the situation was looking the bleakest. However, the recovery from $129 to $161 doesn’t look corrective. It appears to be another five-wave sequence, labeled i-ii-iii-iv-v in wave “a”.
This means wave B is not over yet and wave “c” can be expected to lift MCO stock to the area between the 61.8% and 78.6% Fibonacci ratios. But first, a three-wave pullback in wave “b” of B should drag the price down to roughly $145 a share.
If this count is correct, wave B should terminate in the $165 – $175 price zone. Once there, the 5-3 wave cycle would be complete and wave C down should follow. The long-term prediction for MCO stock trading below $100 remains viable, as long as $188 holds.