EDO/BTC price forecast for the near futureIn this post I applied the following tools: fundamental analysis, all-round market view, market balance level, volume profile, graphic analysis, trendline analysis, the Kagi and the Tic-Tac-Toe charts
Dear friends,
Today, I would like to introduce quite an interesting project, Eidoo, and offer you my EDO/BTC forecast.
First, let’s see what Eidoo project is. This Swiss project doesn’t pretend to be a super start or promise a cryptocurrency revolution. However, it is one of the few projects, holding ICO in 2017 and having a real, operating product now.
Eidoo aims at developing a mobile application that would combine the functions of wallet and an exchange. The advantage of the wallet is that it supports both Bitcoin and all altcoins, based on Ethereum blockchain. The keys to the wallet aren’t stored centralized; they are kept only by the users themselves. On the one hand, it protects from the hacks by the central server; on the other hand, it would be impossible to recover the key if you lose it and have no backup copy.
Another important development of the project is Eidoo exchange. It is already available as a separate application and everybody can install it. The exchange unique feature is that it provides direct exchanging of altcoins without any intermediates, similar to the famous Atomic swap technology. Another project’s feature is the ICO platform. Now, the founders don’t have to create smart contracts as they can directly attract investors’ funds through the application.
It can be quite useful for small projects, as, participating in ICO on the Eidoo platform, you are provided with the whole set of products and services (wallet, exchange, digital identity solutions and multi-thousand audience.
EDO fundamental analysis
So, after a brief description, I’ll go on with some fundamental analysis.
As the entire Eidoo project is, in fact, a single application, one of the most important growth drivers is the number of the software downloads. Currently, it is available only for Android, however, over 100,000 of people have already downloaded the software; it quite a lot for the cryptocurrency community.
The developers have promised to update the application interface and make it more user-friendly, and provide more digital identity solutions, so that you can prove yours identity with your fingerprint or face scan.
Constant work on the product improvement is also aiming at the current users’ benefits. Increased rating of the application among its rivals will make it more popular in the market and attract new subscribers.
Another potential growth factor in the near future is the launch of a gold stable coin EKON, 1 EKON will be equal to 1 gram of gold. The developers have promised to carry out an audit to verify the number of gold bars in their vault every 90 days. They will also install cameras in the storage place so that everybody can make sure in the availability of gold online.
The funds, received from selling this altcoin is also planned to be invested in buying the major Eidoo coin – EDO, which will obviously support the cryptocurrency rate.
Many analysts suggest the next year be the year of stable coin; and the EKON is appearing in the market at the right time. It supports the coin itself and the entire Eidoo project.
EDO/BTC technical analysis
Now, let’s carry out EDO/BTC technical analysis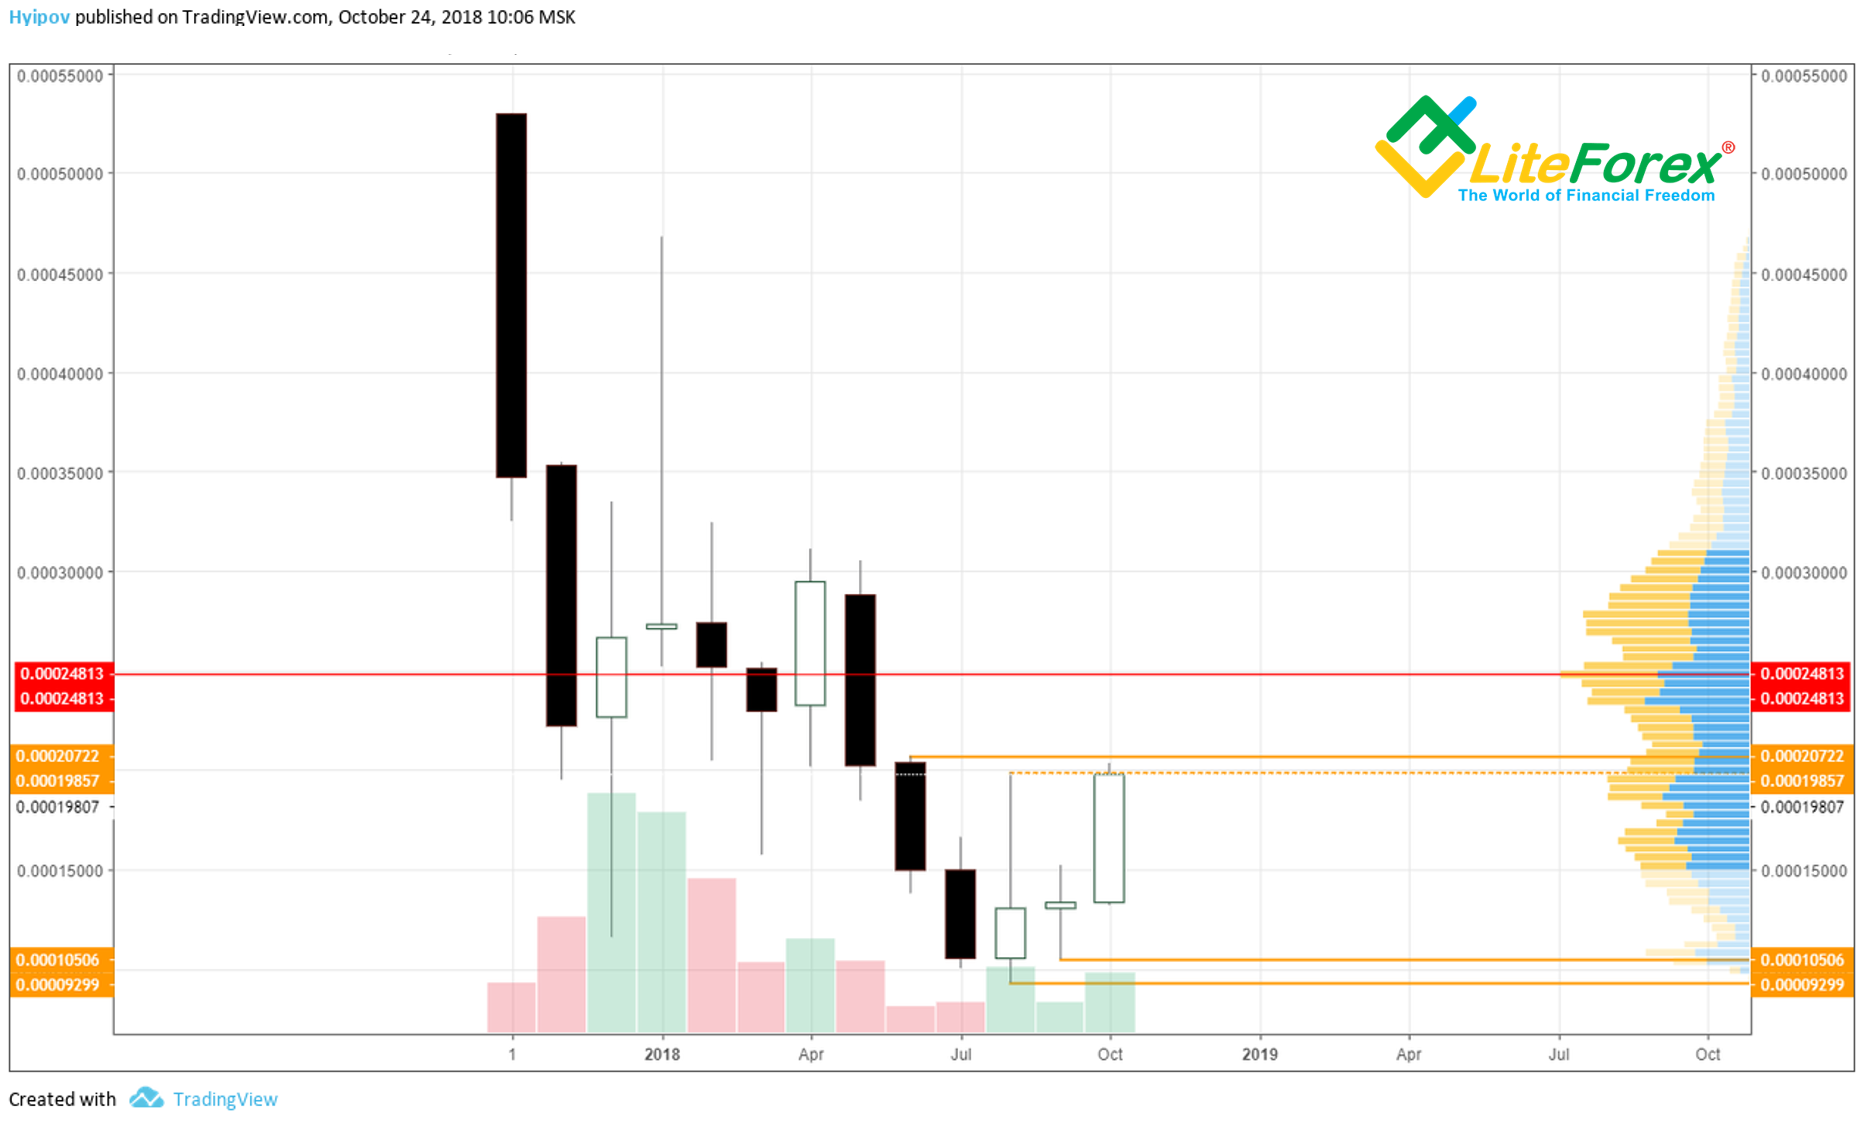
As it is clear from the monthly EOD price chart above, the EOD token has been rather successful during the month. The EDO/BTC ticker has broken through the highs of the two previous candlesticks, which a good sign for the bullish reversal. You see that the market balance level is still quite far, providing much room for growth.
On the other hand, the ticker hasn’t consolidated above the August’s high and break through the June’s high; so, the price may rebound from the channel top border at 0.0002 BTC.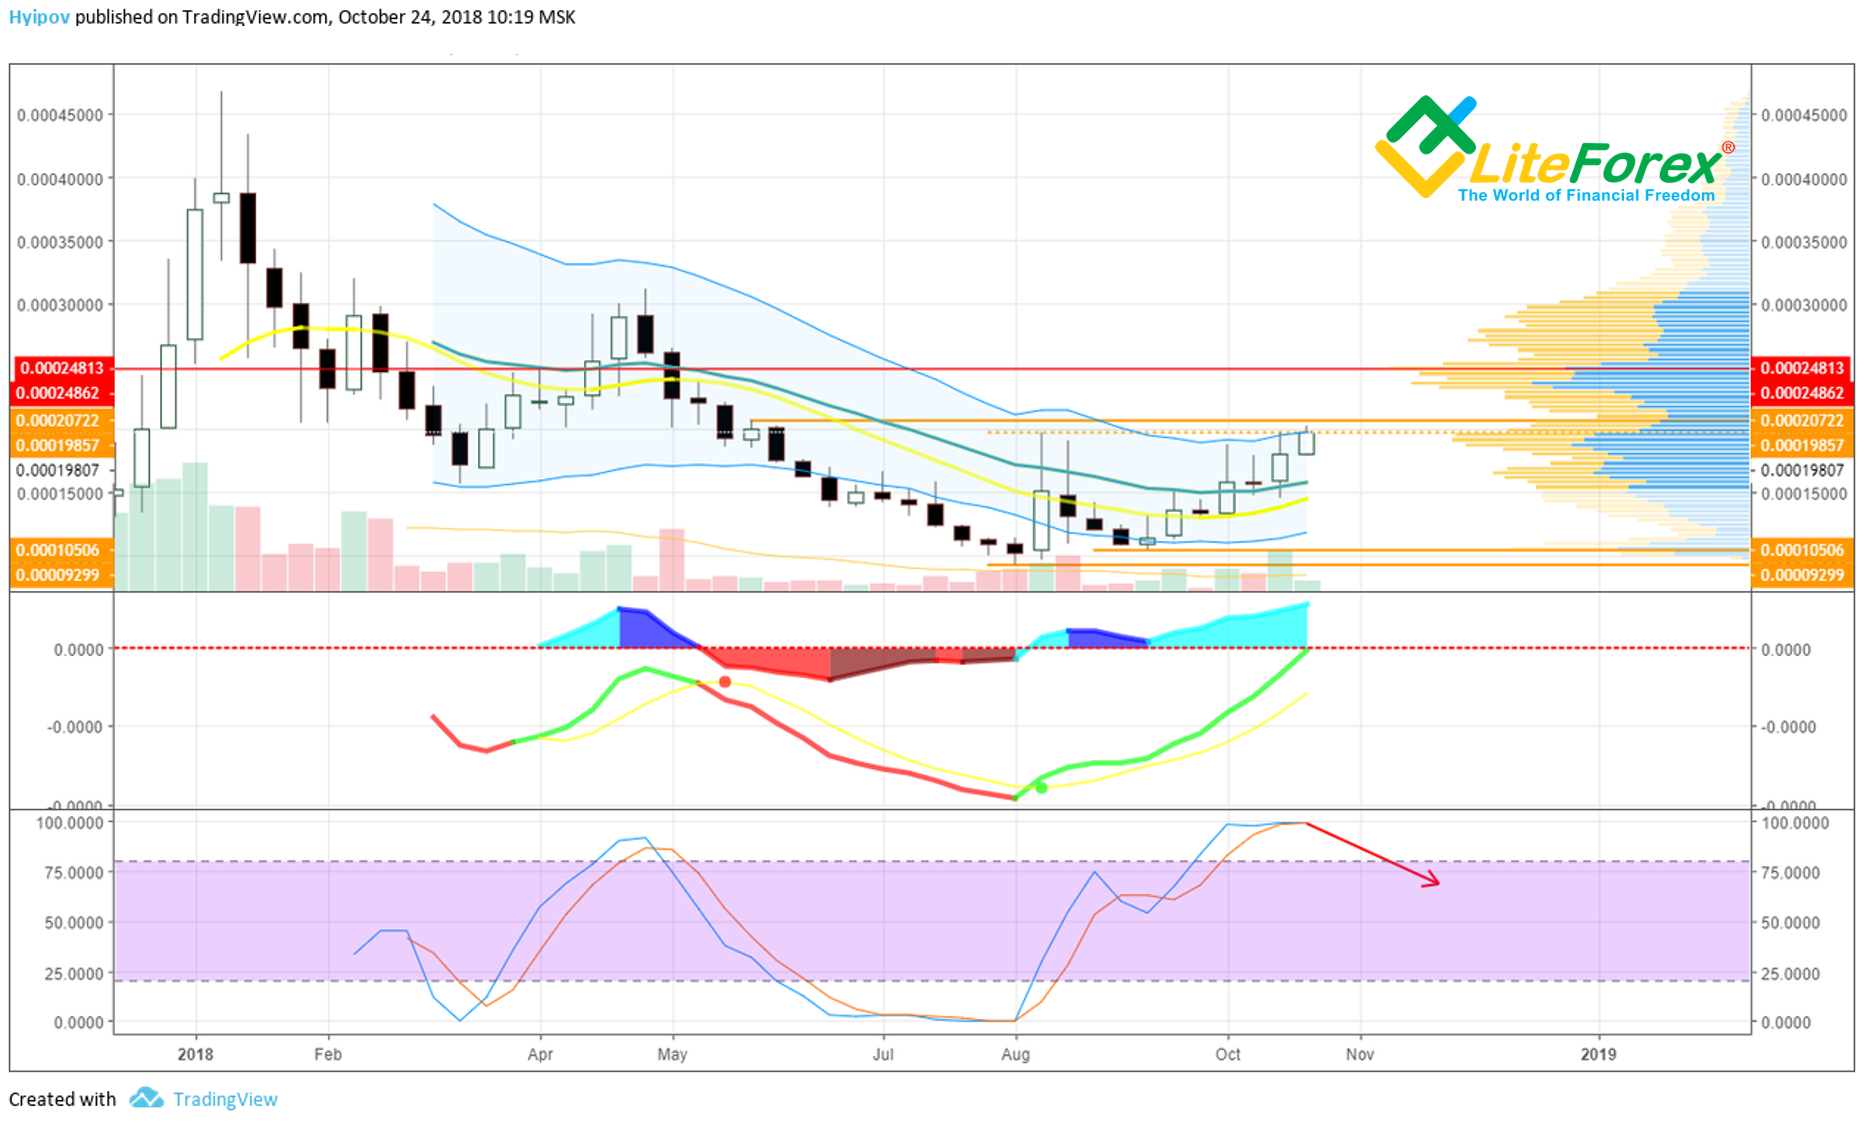
In the weekly EDO price chart above, you see that the ticker is really overbought: RSI stochastic indicates it. MACD hasn’t crossed zero level, which means the buyers’ weakness. In addition, the ticker itself has hit Keltner channel’s top border, creating an additional obstacle to the price upward movement.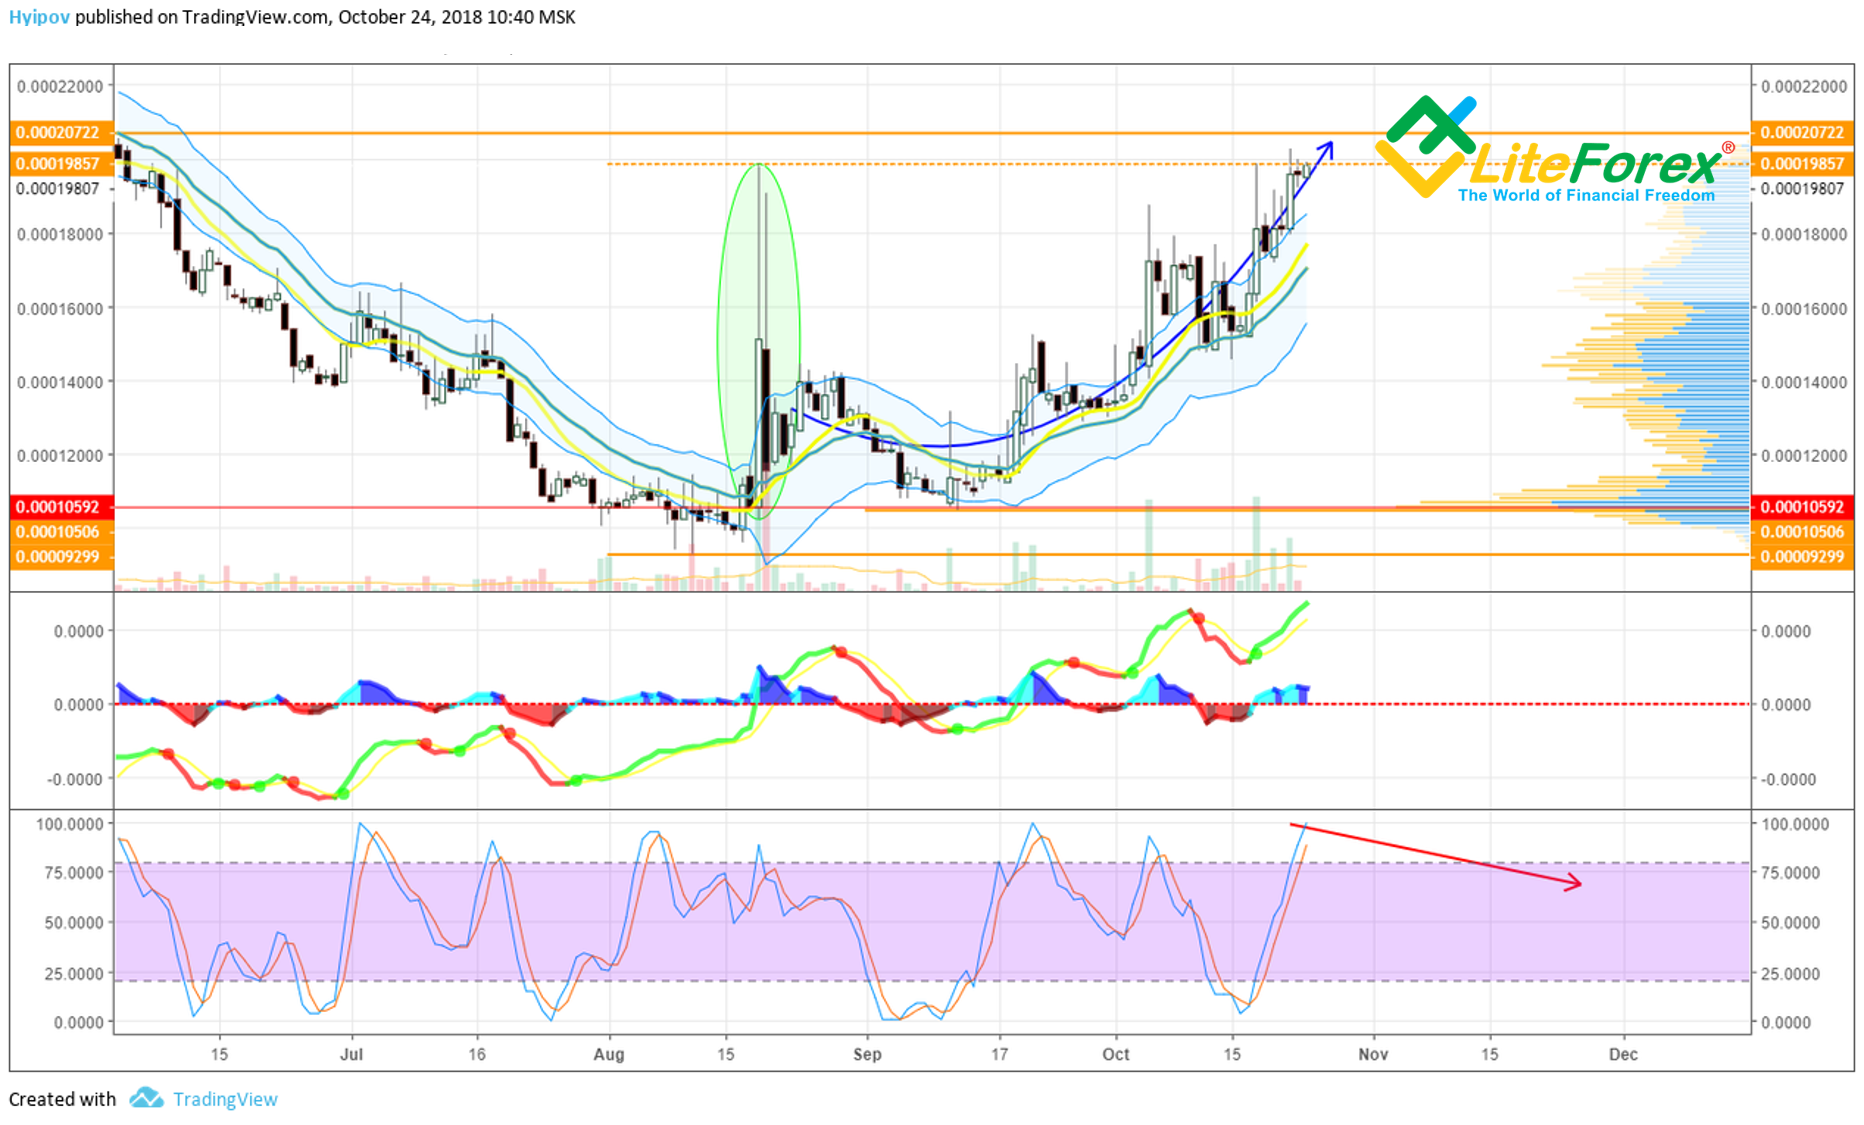
In the daily chart above, it is clear that the momentum in August became the foundation for the reversal. This pattern is quite often featured by the coins of low liquidity, and it is one of the market manipulation means. This pattern can be conditionally called as the level setting. It is based on creating an unnaturally strong momentum that breaks through all the key level and resistance zones. The stronger the impulse is, the better is the result. The effect is breaking the channel’s borders and broadening the trading scope. Manipulators, by means of strong momentum, breaks the resistance levels as well as the psychological barriers, showing that the way for growth is open and it is relevant to buy. Buyers, as a rule, respond positively to such signal and start buying more. It results in the natural price rise, along the entire momentum length.
The problem arises when the market reaches the momentum border, as it is in case with EDO now. Here starts a dilemma. On the one hand, manipulators expect the market response and try to understand whether it will go on increasing on its own. On the other hand, buyers, used to the easy price growth, expect another high, resulted from a strong momentum.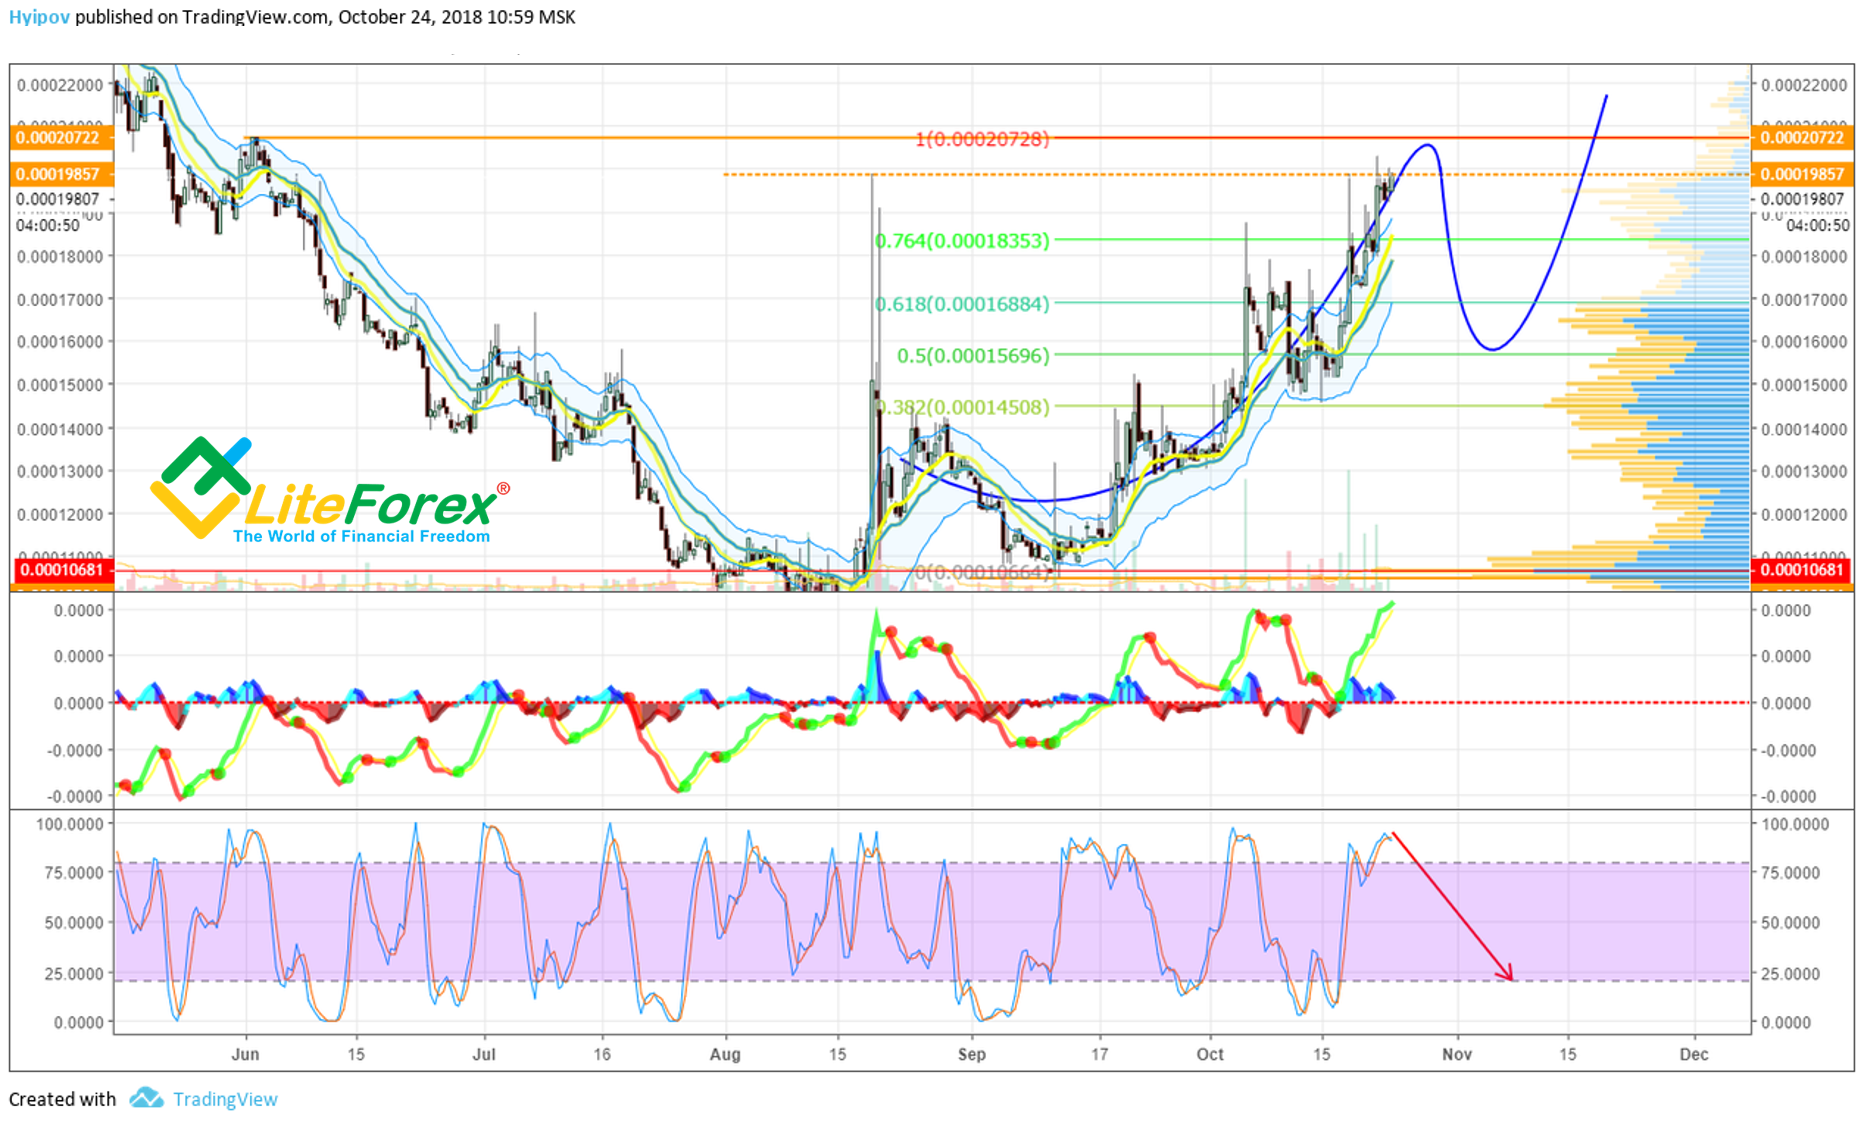
It can result in a narrow channel, emerged in the market, looking like a sideways trend or a sloped wedge. Ironically, manipulators, to ease the tension, will be the first to start selling to raise the funds.
Finally, there is a drawdown that may reach a half of the last growth wave or even deeper.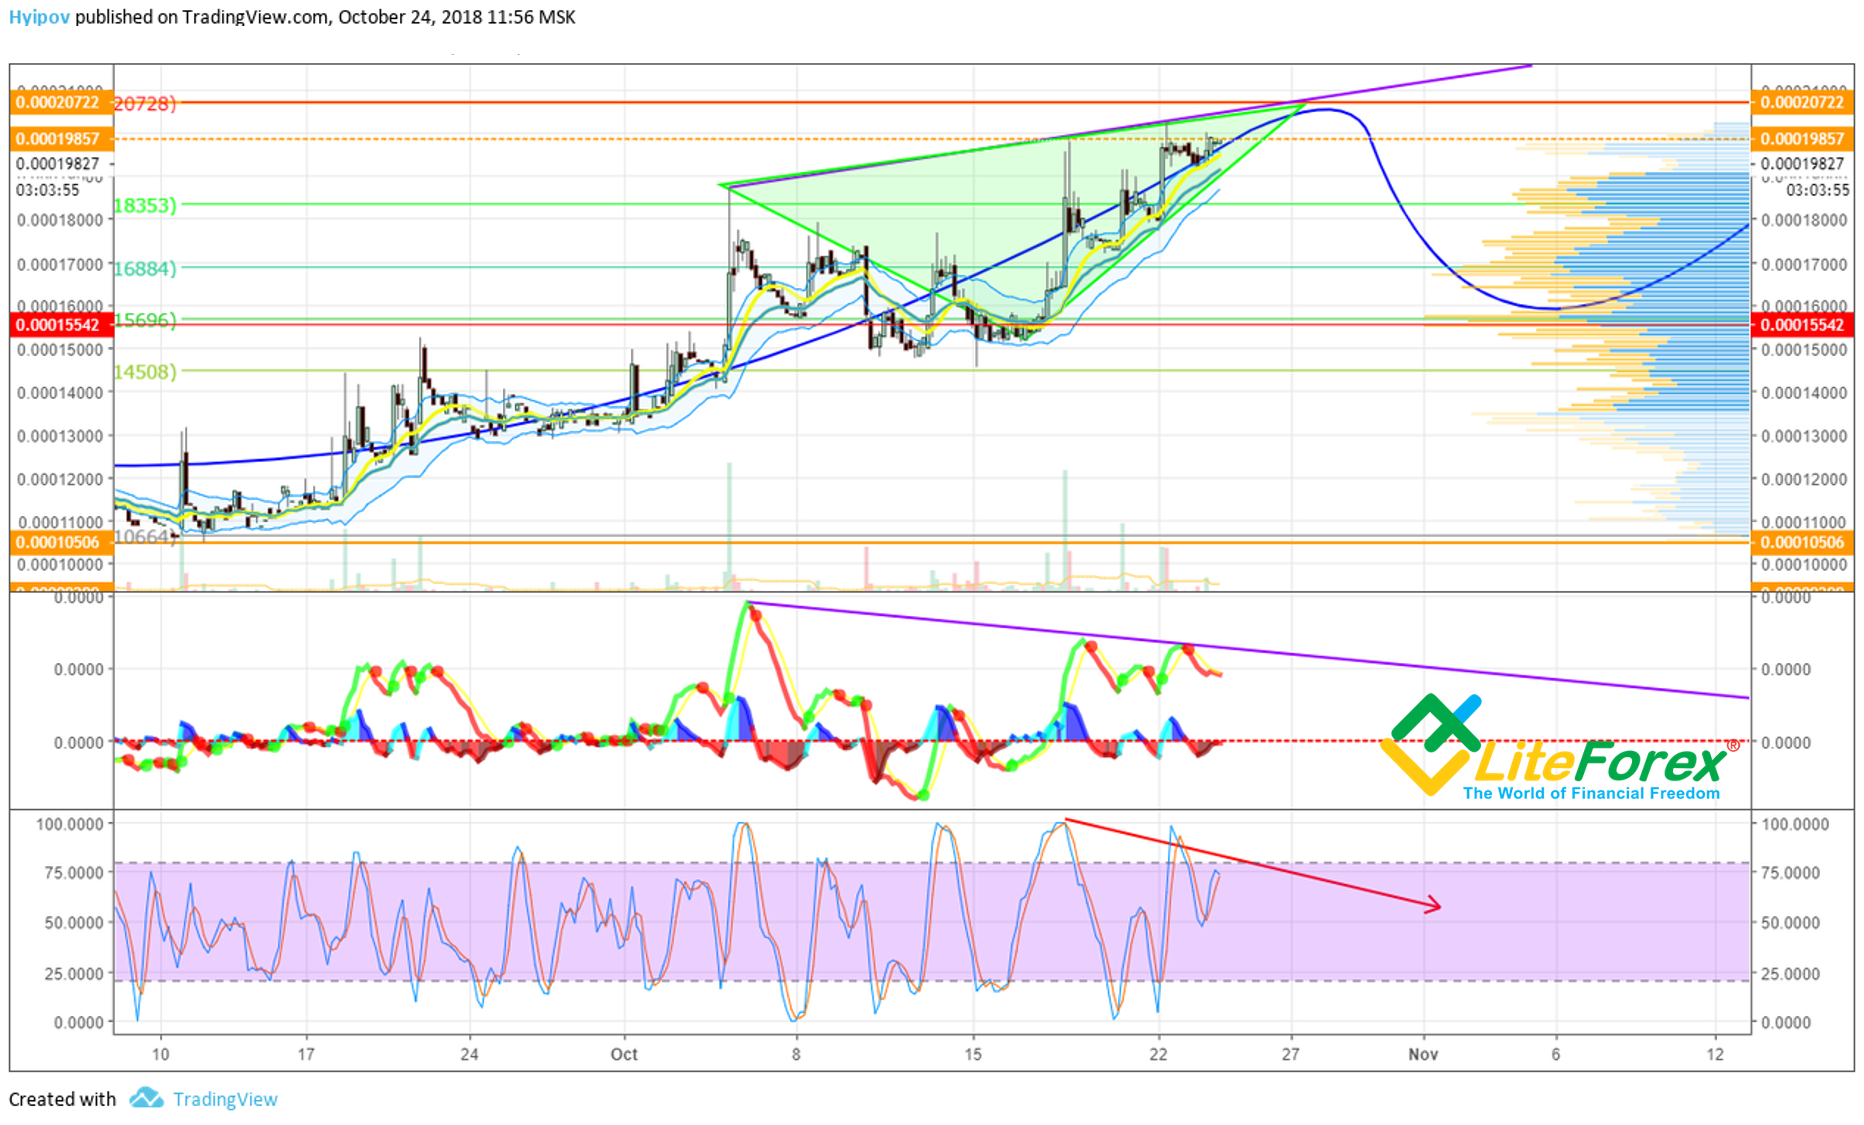
In the four-hour chart above, there is a series of strong bearish divergences. Combined, they are the strong signal that the ticker will go down lower. In addition, there is a rising wedge. This pattern is most often broken out from above, according to statistics. As the pattern base is at 0.00015 BTC. The EDO price can well be corrected down to this level.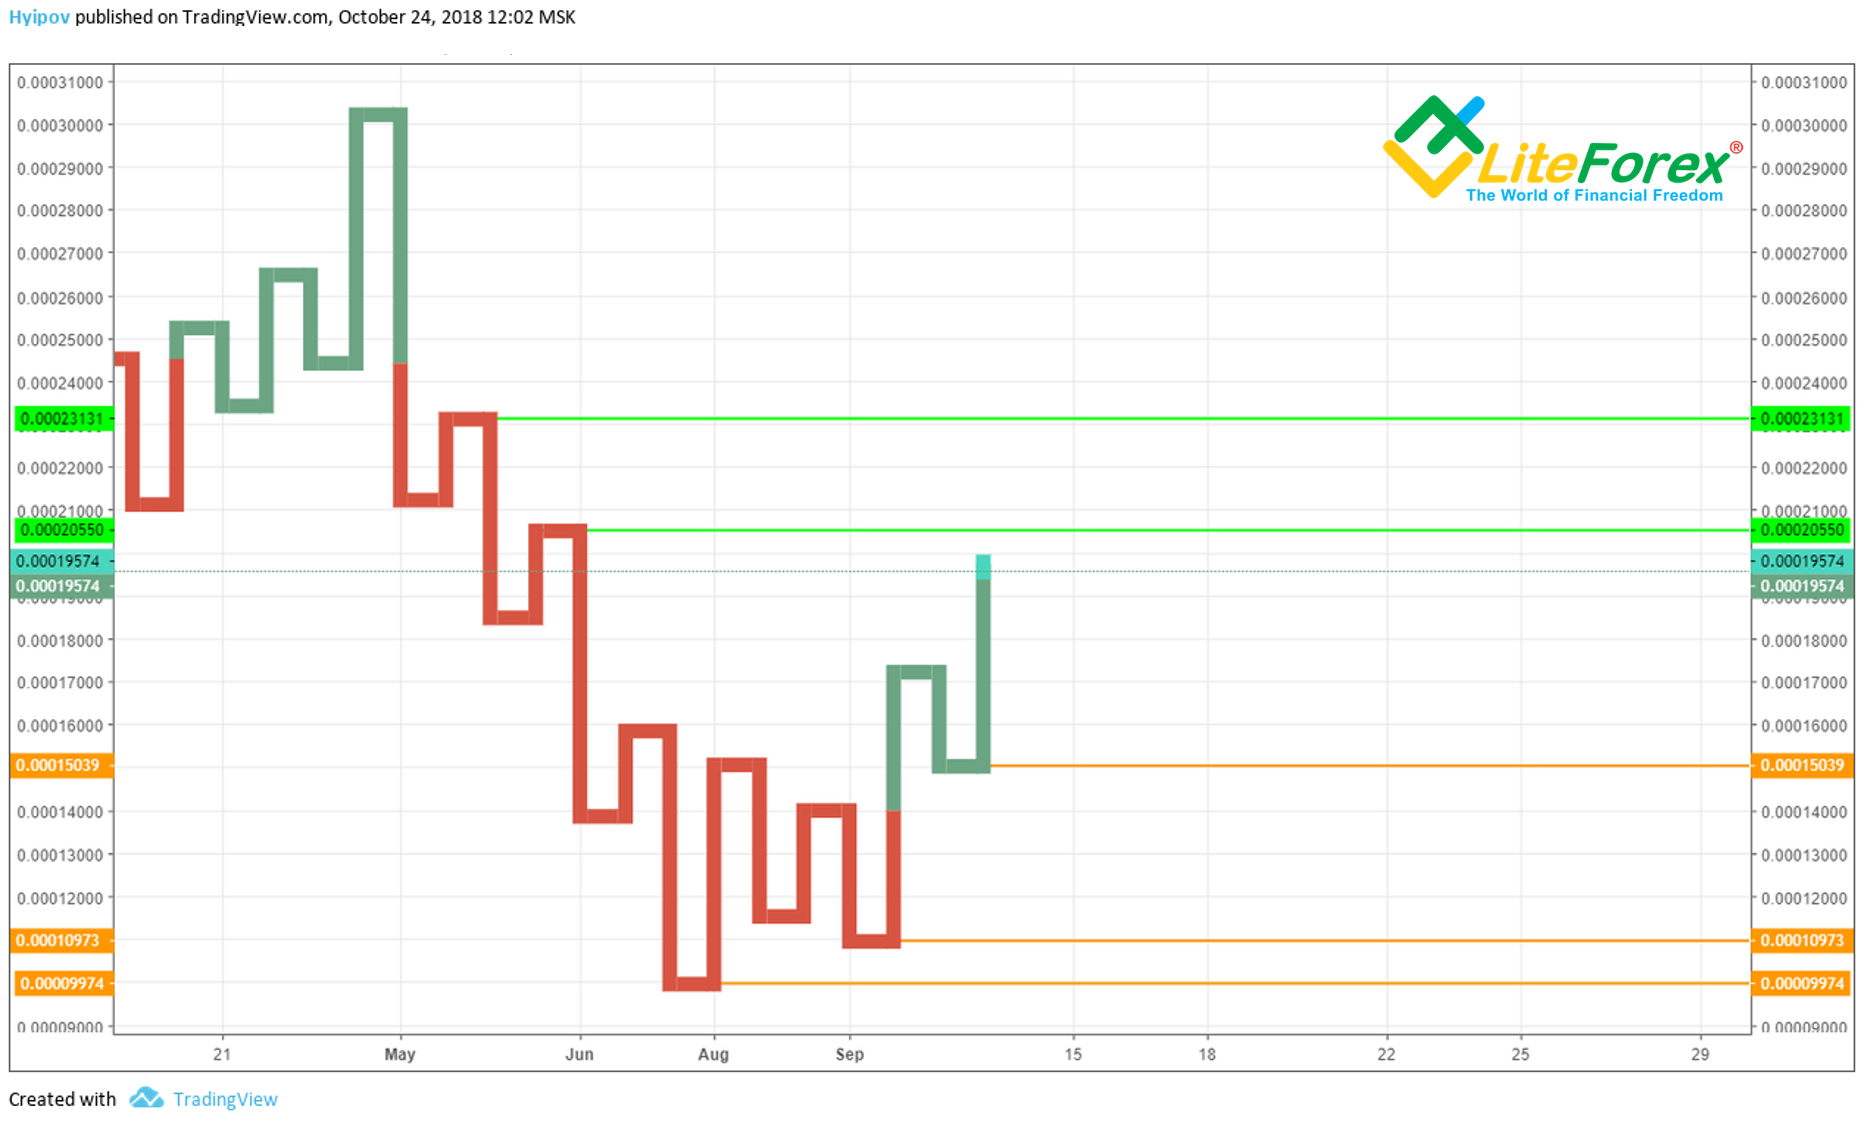
The daily Kagi chart above also indicates the closest resistance level at 0.00020 BTC and the support level at 0.00015 BTC. In addition, this level is at the waist of the last Kagi. Even if the EDO price is corrected down to this level, the general bullish trend won’t be broken. There will still be bullish sentiment, which suggests a natural correction in the bullish trend down to this level.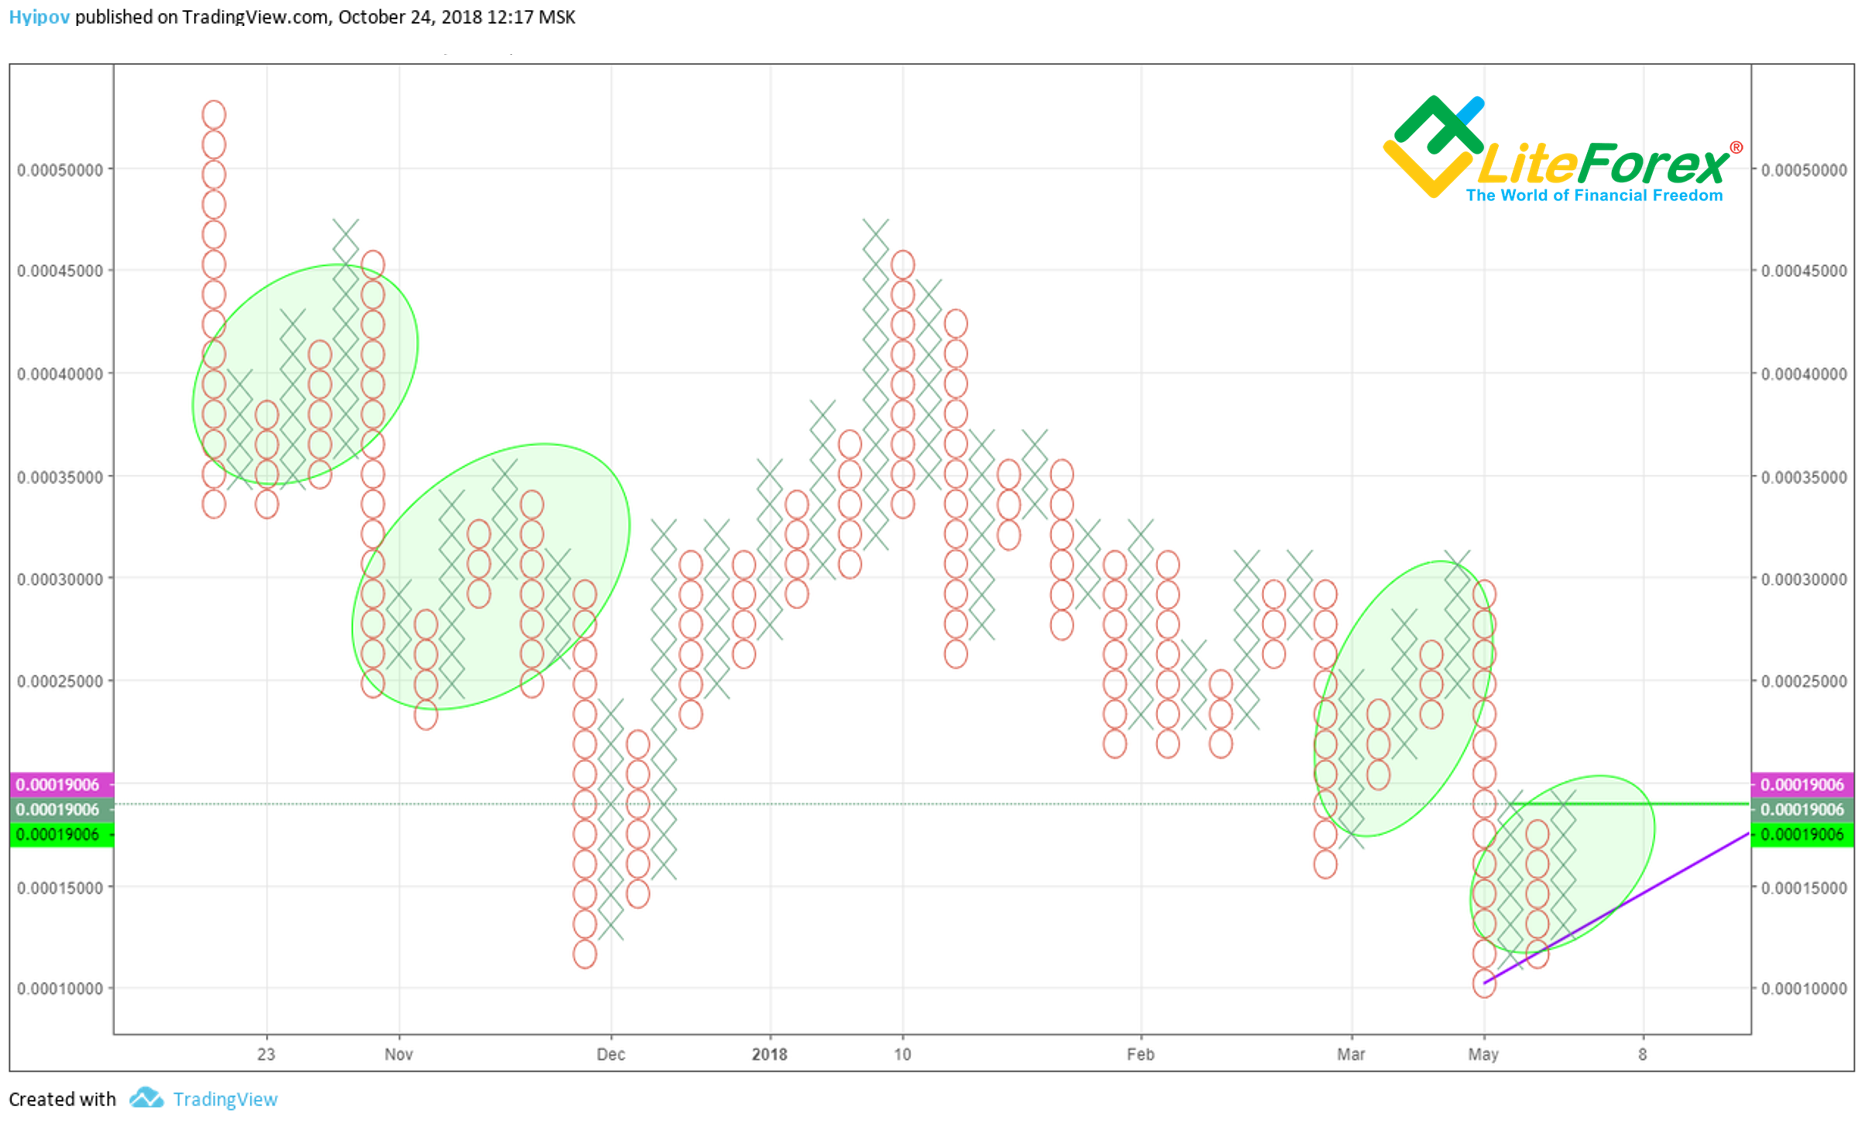
As it is clear from the Tic-Tac-Toe chart above, the strong momentum doesn’t start until there appear three columns with Xs and two columns with Os. So far, there have been only two Xs columns and on O column in the pattern. This formation is not crucial, of course, but can be good signal to confirm the other ones. Now, this suggestion fits in the general scenario of soon price correction.
Summary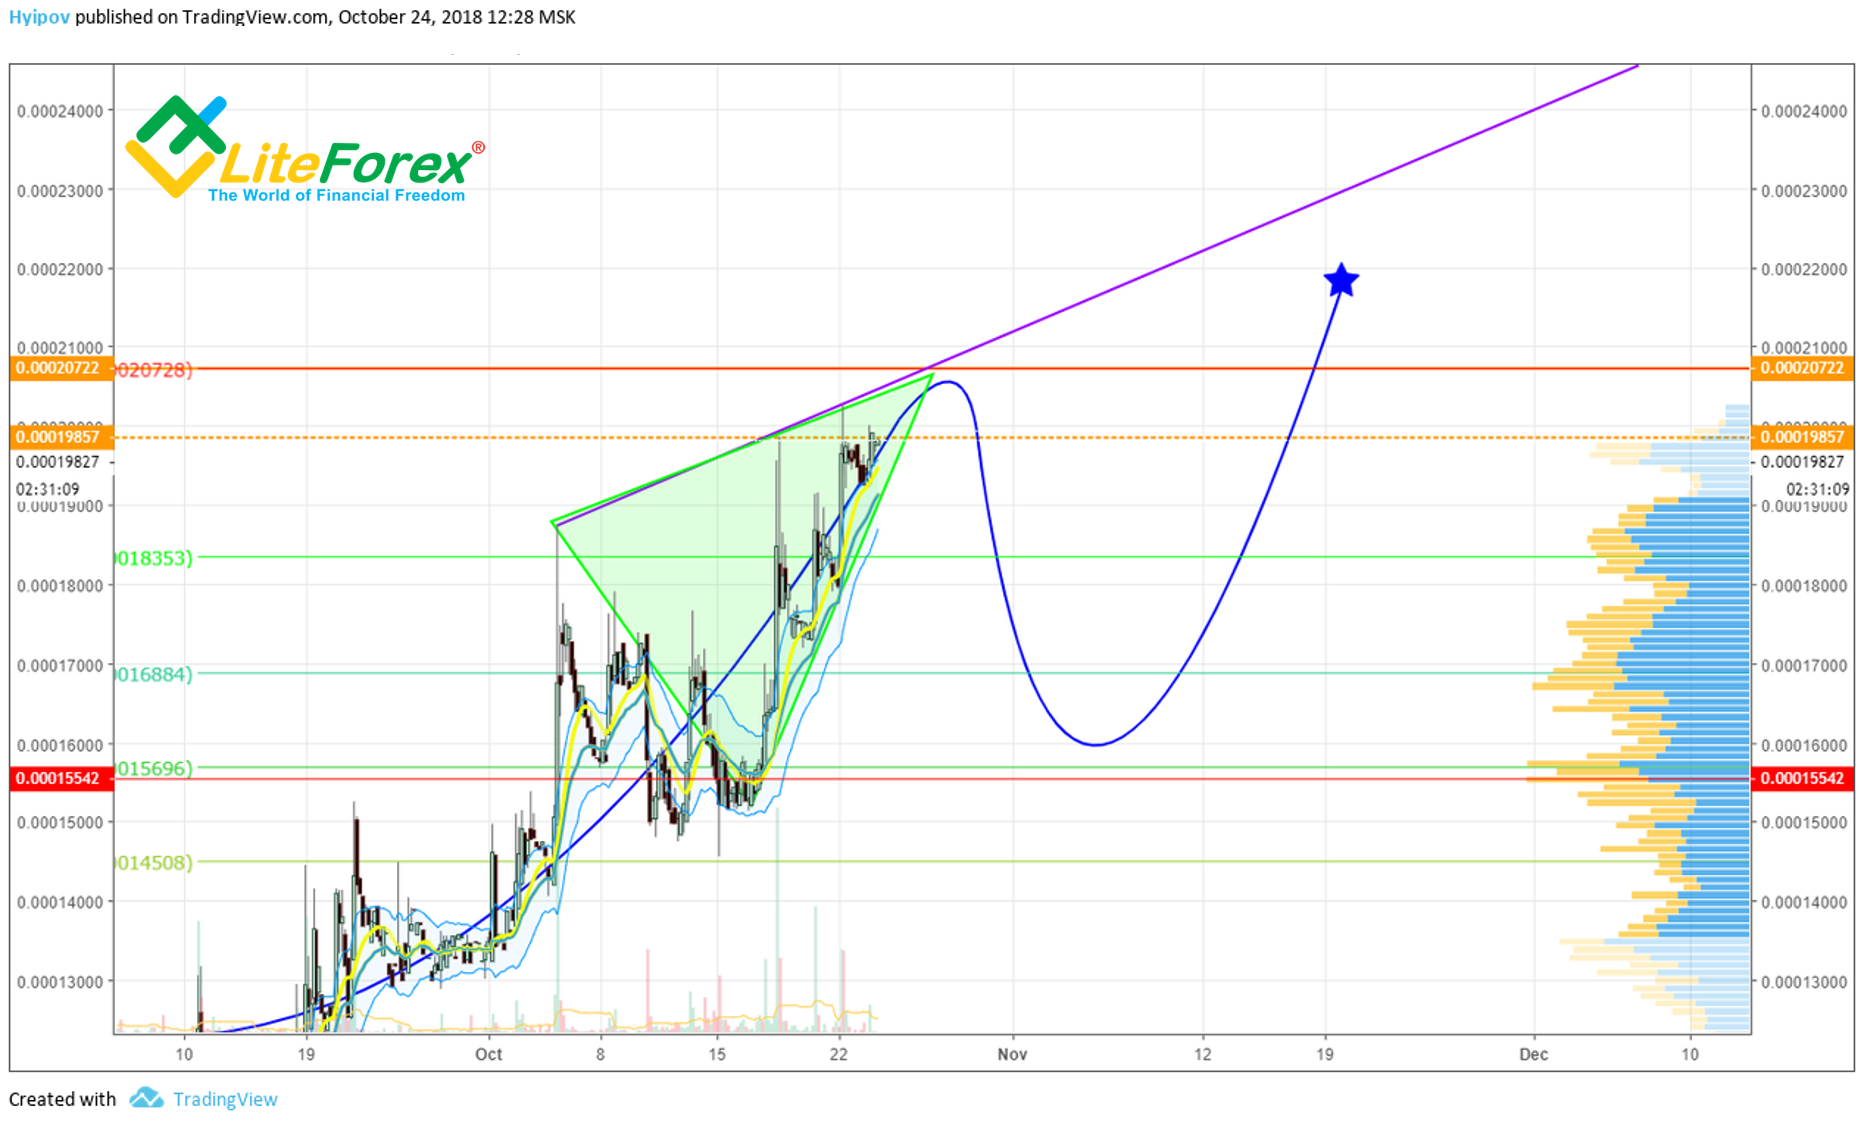
Summing up all the above, I can suggest that EDO/BTC has a strong foundation for the long-term growth; however, the instrument is now overheated and should blow off the steam. The recent growth wave can start a really strong long-term trend. Here the future price will be determined by the project developers. If they don’t support the cryptocurrency the EDO/BTC pair can slide down to the sideways trend and start trading in the channel between 0,00015 – 0,00021.
The scenario for the near future suggests that EDO/BTC should be trading in the narrow sideways trend, close to the highs at about 0.00019 BTC– 0.00021 BTC; the following correction down to 0.00015 would be natural. This rollback would be a good base for creating another upward momentum and breaking out the resistance levels. The actual situation will be clear after the correction has happened.
