A significant issue facing investors is determining whether the world is entering into a global recession. Certainly, economic activity in emerging markets has been challenged due in part to the strength of the U.S. dollar. Global economies are also dealing with the collapse of energy prices and the negative impact energy weakness is having on the broader industrial sectors as energy capital expenditure cuts ripple through the economy. As noted in our post yesterday, historically, energy prices and equities have a positive correlation, that is, they move in the same direction. Intuitively this makes sense as a stronger global economic environment leads to a higher demand for energy resources. Since late 2013 this correlation broke down and energy prices began to move in the opposite direction of stocks. When January 2016 rolled around though, the correlation between oil and stocks once again turned positive.
Absent ongoing excess supply, weaker energy prices have been one signal the economy is slowing, however, is something different occurring today that is causing this disconnect? We think so and it has to do with too much supply and not a reduction in demand. So back to the recession question. Below are a few economic variables which we believe tilt towards a growing economy, albeit a slow growth one.
Indicators exhibiting a positive trend:
- Jobless Claims
- Consumer Confidence
- Existing Home Sales
- Retail Sales
- Interest Rate Spread (the TED spread)
The three indicators showing weakness:
- Durable Goods Order
- Industrial Production
- ISM Purchasing Managers Index (Manufacturers Survey)
Jobless Claims
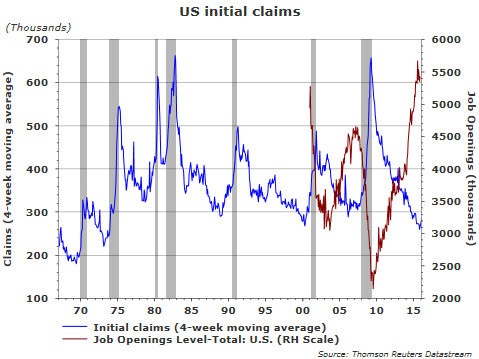
Continued improvement is seen in the 4-week moving average of initial jobless claims with the latest reading reported at 283,000. Additionally, the Job Opening Level (red line) continues to move higher and is far above the level prior to the last recession.
 |
Existing Home Sales
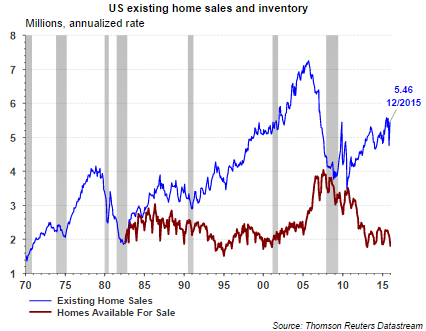
In December the National Association of Realtors reported a 14.7% seasonally adjusted annual rate of growth in existing home sales. This puts the number of units at 5.46 million for December versus the annual rate of 4.76 million in November. The median home price rose 7.6% in December 2015 versus the same period in 2014. One factor contributing to sale price increases is the low level of homes for sale. Potential headwinds to home sales in 2016 is potentially higher mortgage rates as the Fed continues to move interest rates higher and a weak home market in areas negatively impacted by weak energy prices.
 |
Retail Sales and Consumer Confidence
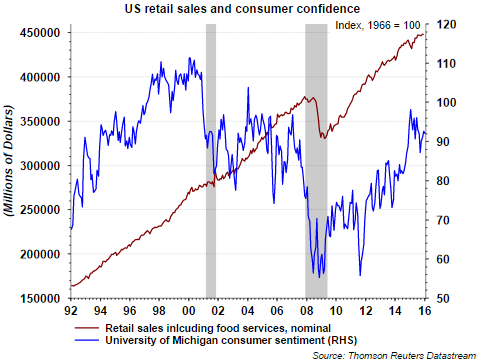
For the month of December 2015, retail sales did decline .10% versus November. For the fourth quarter of last year, retail sales were up 1.8% versus the same time period in 2014. Included in the below chart with retail sales is consumer confidence and the trend in confidence continues its upward trajectory. With the decline in energy prices and a strong confidence level, retail spending is likely to maintain its upward trend. The economy is unlikely to dip into recession when consumer confidence continues to exhibit strength.
 |
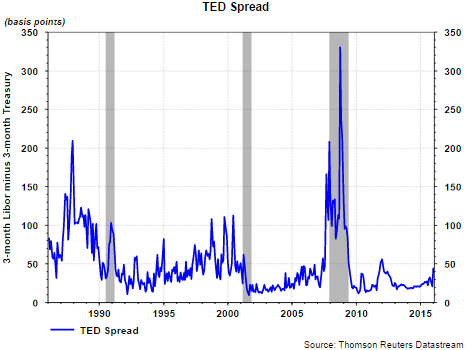
TED Spread
The TED Spread is the difference between the yield for 3-mo Treasury Bills and 3-mo Libor. The spread represents the premium investors require to lend money to a bank rather than to the U.S. Treasury. The spread has remained below 50 basis points since early 2012. The spread spiked above 50 in January 2012 on the back of the gridlock in Washington D.C. surrounding the debt ceiling debate and the eurozone crisis that involved Greece. The current spread is elevated and worth watching; however, readings below 50 are indicative of an environment where credit risk among counterparties is not increasing.
 |
Durable Goods
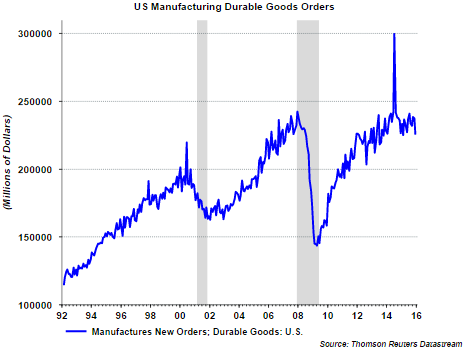
As reported by the U.S. Census Bureau, new orders for manufactured durable goods in December declined 5.1%.
The decrease, down four of the last five months, followed a 0.5 percent November decrease.
Excluding transportation, new orders decreased 1.2%.
Excluding defense, new orders decreased 2.9%. Transportation equipment, also down four of the last five months, led the decrease, down 12.4%.
 |
Industrial Production and ISM Purchasing Managers Index
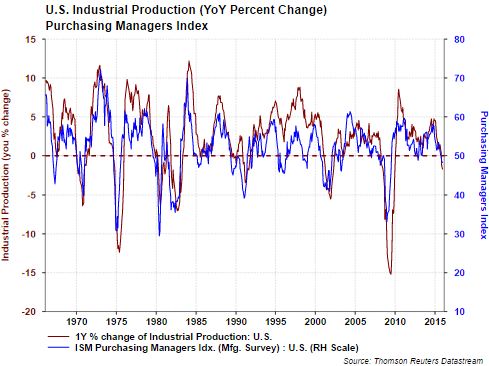
In December Industrial Production declined .4% and was centered in weakness in utilities and mining. The weakness in the utilities sector is the direct result of a warmer winter across parts of the U.S. Weakness in mining reflected lower commodity prices and contraction in energy extraction,
Weakness in the ISM Manufacturing Index was centered in the decline in employment by 2.1 points. The one positive from the report was the increase in new orders which came in at 51.5.
 |
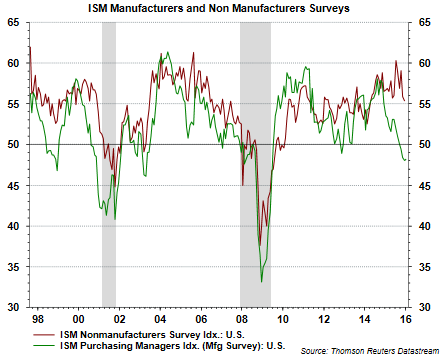 |
The bright spot in these last two surveys is the fact the non-manufacturing survey continues to show strength as seen in the above chart. As reported by Econoday,
"There may be export-related weakness in the manufacturing sector but it has yet to spill over to the overall economy. ISM's non-manufacturing index did slow 6 tenths to 55.3 in December but the level is still very solid and details are positive. New orders are up 7 tenths to a very strong 58.2 while employment is also up 7 tenths, to 55.7. The sample is building up inventories which hints at expectations for solid business ahead. Another positive is the export index which, like the ISM manufacturing report issued Monday, bounced solidly higher and back into the plus-50 growth column, at 53.5. Input prices show very little change. This report continues to be consistent and solid, underscoring the strength of the nation's domestic-based economy."
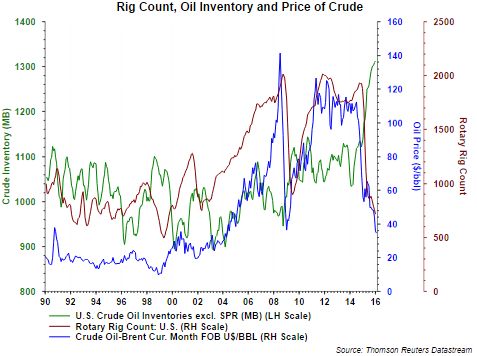
In conclusion, the weaker aspects of the economy appear to be centered in the manufacturing sector and the energy sector. Importantly, the U.S. is a consumer led economy where manufacturing represents 12-14% and consumer and services represent the other 85%. The energy weakness is one were too much supply is straining companies with direct or indirect energy exposure. This growth in oil supply (green line) is evident in the below chart which was included in yesterday's post.
 |
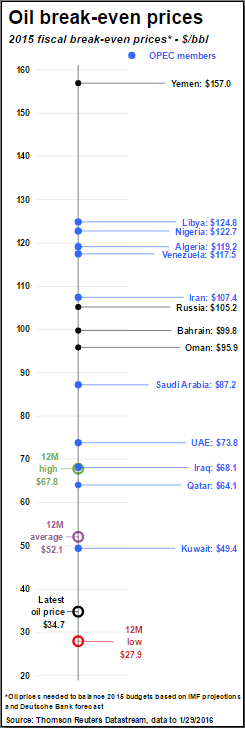
Aside from the marginal energy producers going out of business, a supply cut seems necessary to correct the demand/supply imbalance. Countries with state owned oil operations should be the most highly motivated to curtail supply. As the below chart indicates, many of these countries require oil prices that are significantly higher than where oil is trading today in order to balance their budgets. The risk these countries are facing beyound running out savings, is the potential to push the global economy into recession. In that situation demand declines and supply becomes an ever larger overhang. Oil could easily trade in the mid to low teens per barrel if this were to occur. We do not see a recession at the moment given the benefit lower energy prices have on the consumer segment of the economy.
