Here we are in THE Great Bull Market (although it is becoming a rough ride recently) which has for months been oblivious to an obvious slowing of the USA economy. The purported forward looking markets have divorced themselves from economic reality.
Follow up:
I realize many ignore (or literally despise) ECRI and their Weekly Leading Index which has been forecasting a slowing economy for almost a half year - yet, the slowing economy has arrived. As ECRI's index is advertised to have a six month view, its continued weakness does not bode well for the rest of 2015. Even the Fed, who historically have been insensitive to economic change, has noticed - here is a quote from their latest meeting statement:
Information received since the Federal Open Market Committee met in January suggests that economic growth has moderated somewhat.
There is no question that weather and the labor issues at the West Coast Ports have been headwinds to the economy over the last few months. It is hard for many to imagine how the port labor issues could slow an economy - but a domino effect has rippled through the economy. There is almost NO product or service anywhere in the world where 100% of the elements necessary for performance were completely from that country. The world is becoming increasingly globalized & interdependent, and constraints to trade will negatively correlate to economic activity.
What proportion of this current economic slowdown is transient (caused by the weather or labor issues) or from a boom / bust economic cycle? Much of the data used in coincident indicators are subject to backward revision - and by the time the coincident indicator is based on final data - a half year has passed.
Even forward looking indicators such as the Leading Economic Index from the Conference Board is based 40% on data subject to backward revision. Further, many elements of this index are not from real time data releases - so turning points or rate of change may not be evident for months.
In any event, the Conference Board Leading Economic Index and the American Chemistry Council Chemical Activity Barometer leading index join ECRI in predicting slower growth for the next 6 months or more.
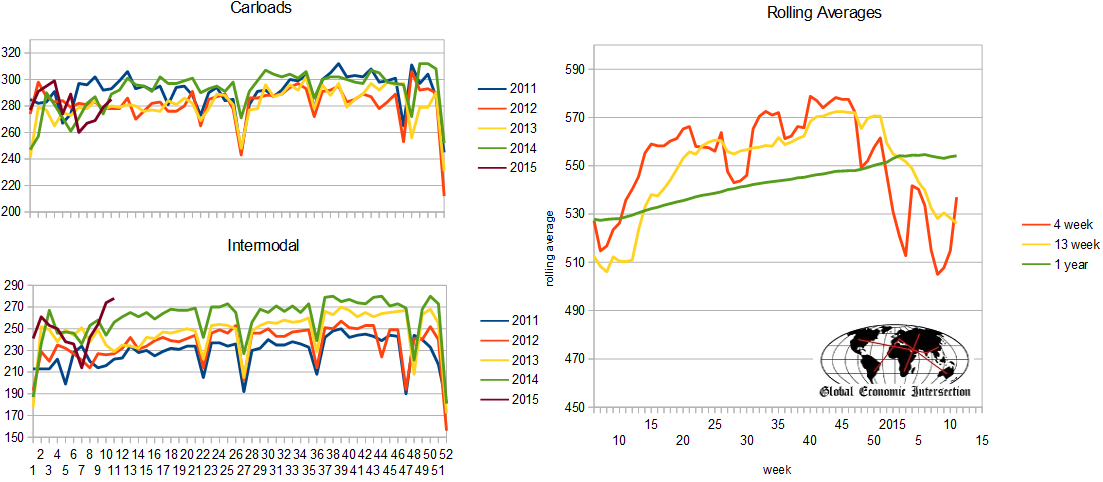
What I am currently watching is rail counts which look ugly. Rail is a real time reflection of economic activity. Rail is reported in two major categories - carloads and intermodal (trailers or containers on railcars). Intermodal has been heavily affected by the West Coast Ports - and over the last few weeks has returned to the growth ranges seen before the West Coast issues. But carloads (chemicals, coal, oil, motor vehicles, grain, farm products, etc.) are struggling. Even removing coal and grains from the analysis shows a CONTRACTION. Here again, the problem is that weather does affect rail car loadings, and the port issues cascades throughout the supply chain (so it affects much more than the initial intermodal movements from the ports).

I believe the clues are too abundant to poo-poo that the USA has entered an economic soft spot. Many long view economic sectors we watch remain in positive territory - so there is no evidence that the USA is headed towards a recessionary cycle. But one always worries that economies are ripe for an economic shock when there is economic softness.
Other Economic News this Week:
The Econintersect Economic Index for March 2015 continues to show a growing economy, but the rate of growth is decelerating. All tracked sectors of the economy are expanding - but most sectors are showing some slowing in their rate of growth. The negative effects of the recently solved West Coast Port slowdown (a labor dispute which had been going on for months) can be seen be seen in much of the raw data - and it will be an economic drag on 1Q2015 GDP. Although beyond our forecast view, we expect a slight economic bounce in the coming months as a trillion dollars annually of cargo begins to traverse the West Coast Ports again in a normal flow.
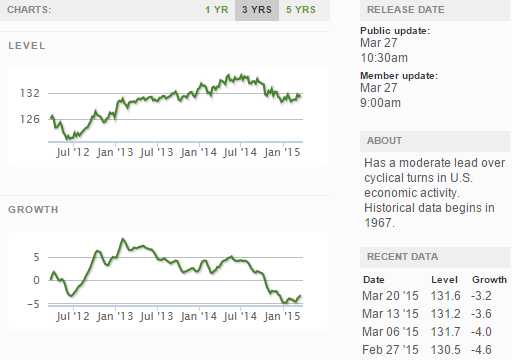
The ECRI WLI growth index remains slightly in negative territory which implies the economy will have little growth 6 months from today.
Current ECRI WLI Growth Index
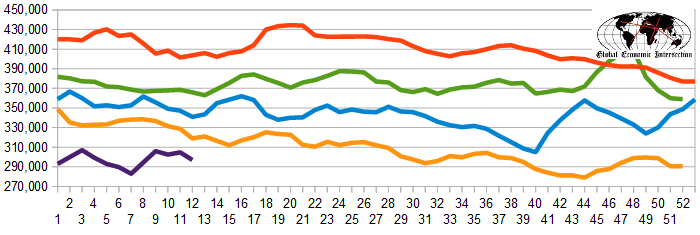
The market was expecting the weekly initial unemployment claims at 282,000 to 300,000 (consensus 293,000) vs the 282,000 reported. The more important (because of the volatility in the weekly reported claims and seasonality errors in adjusting the data) 4 week moving average moved from 304,750 (reported last week as 304,750) to 297,000. The rolling averages have been equal to or under 300,000 for most of the last 6 months.
Weekly Initial Unemployment Claims - 4 Week Average - Seasonally Adjusted - 2011 (red line), 2012 (green line), 2013 (blue line), 2014 (orange line), 2015 (violet line)
Bankruptcies this Week: None
Click here to view the scorecard table below with active hyperlinks
Weekly Economic Release Scorecard:


