This week we have seen various real estate releases. What these releases are whispering is that the headwinds are abating - but in perspective, the real estate industry remains a mere shadow of its former self. One of the reasons for the sluggish USA economic recovery is due to real estate:
- decimated the net worth of real estate owning consumers;
- flooded the market with distress properties needing quick sale putting downward pressures on home values (and appraisals): and,
- removed from GDP residential construction.
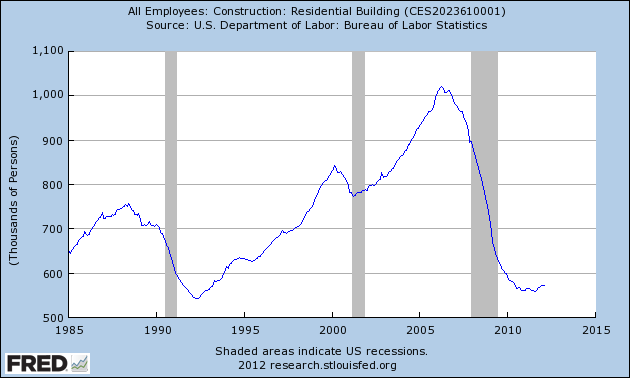
It likely will be years (decades) before real estate feels healthy. Take a look at the jobs picture in residential real estate construction. Jobs, a non-financial indicator – is the best snapshot for understanding the current influence of home construction on the economy.

Building permits are the fuel for the new residential real estate construction. When there are more residential building permits issued than completions, we can understand that at some time in the future completions will rise.

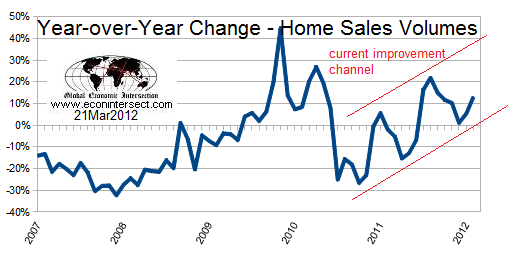
Existing home sales volumes are improving after recovering from the withdrawal of the first home buyers tax credit in 2010. Sales volumes must continue to grow before prices can be expected to stabilize.

An interesting observation on the above graph is the size of the sawtooth cycles since mid 2010. As this data is analyzed year-over-year, seasonal variations are eliminated. It is almost as though the economy is surging, then slowing, then surging again. I see this effect in a few other economic pulse points also – and I continue to wonder if this is a New Normal effect.
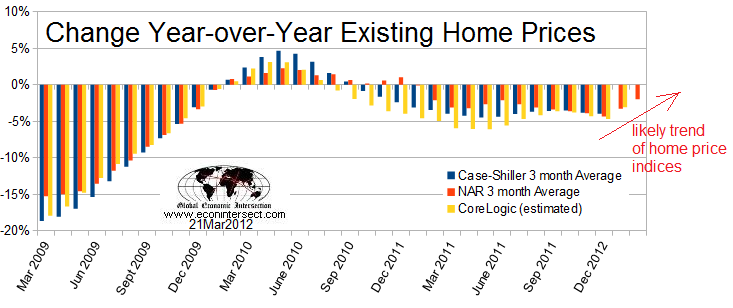
Major home price indices are still showing declining home prices other than the artificial improvement period seen during the government’s stimulus programs for first time home buyers.

Admittedly, I am stretching when establishing the trend line (not enough data points) but with foreknowledge of home prices from Altos Research – I am somewhat comfortable predicting this trend, and believe unless a black swan occurs – home prices will be stable or slightly improving before mid-year 2012.
Stable real estate prices will stop degradation of homeowners equity - throttling mortgage delinquencies, short sales and foreclosures - effectively removing the major downward pressure on home prices. Foreclosures and short sales normally sell at a discount to existing appraisals - and re-establish appraisals at this new level. Low appraisals limit the mortgage amounts.
A contrary note is that the shadow inventory (delinquent mortgages, homes in the foreclosure process, and real estate owned by banks but not for sale) has remained constant since October 2011. In other words, there has been no reduction in the potential pipeline of homes that will sell at a discount.
However, the growth of home sales volumes should offset the negative effects of the shadow inventory pipeline. If so, 2012 should be the end of the Great Real Estate death spiral.
Other Economic News this Week:
The Econintersect economic forecast for March 2012 continues to indicate a growing economy. This index essentially uses non-monetary measures (counting things) to determine economic growth or contraction. Several of this index’s components draw on transport industry movements.
ECRI has called a recession. Their data looks ahead at least 6 months and the bottom line for them is that a recession is a certainty. The size and depth is unknown but the recession start has been revised to hit around mid-year 2012.
This week ECRI’s WLI index value continues to be less bad at -0.4 - a negative value but the best index value since August 2011. This is the ninth week of index value improvement. This index is indicating the economy six months from today will be weaker - but increasingly marginally.

Initial unemployment claims essentially fell from 353,000 to 348,000 – a number last seen in March 2008. Historically, claims exceeding 400,000 per week usually occur when employment gains are less than the workforce growth, resulting in an increasing unemployment rate (background here and here). The real gauge – the 4 week moving average – fell from 356,250 to 355,000. Because of the noise (week-to-week movements from abnormal events AND the backward revisions to previous weeks releases), the 4-week average remains the reliable gauge.

The only data released this week which contained economically intuitive components (forward looking) was rail movements – troubling since it contains declining components normally associated with a declining economy.
Weekly Economic Release Scorecard:
Click here to view the scorecard table below with active hyperlinks.
Bankruptcies this Week: Neurologix, TaxMasters and TMIRS Enterprises, Elpida Memory, Arcapita Bank
Failed Banks This Week:

