Forex News and Events
The ECJ non-binding opinion on the OMT has been soft as expected. The ECJ stated that the OMT is legitimate as long as it meets certain conditions. The ECB should avoid to step into a direct aid program and must outline reasons for adopting such unconventional measures. At this point, the ECB has no difficulties in justifying intervention through unconventional channels. First, the threat of deflation is slowly concretizing due to slow economic recovery in the eurozone. Second, the weak oil prices is set to push the deflation deeper and the inflation expectations further down in the coming months. It seems that the ECB has got the green light for a full-blown QE.
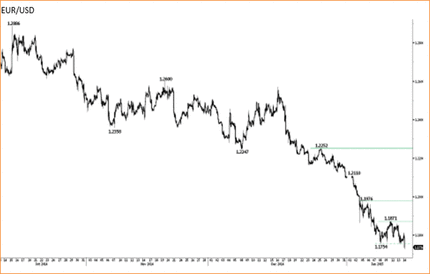
The ECB introduced a number of unconventional measures in the second half of 2014, alongside with negative rates. Two rounds of targeted LTRO and the private debt repurchases program failed to meet the expected popularity, giving reason to the ECB to push the balance sheet expansion harder via a Fed-like QE (public debt purchases). We are uncertain about the efficiency of this potential step on the real economy, yet the negative pressures on the EUR-complex should intensify. EUR/USD broke the historical support of 1.1743 (level of inception in January 1st 1999). We see room for extension of weakness. We set our next target at 1.1640 (2005 low).
EUR/GBP steps back in the bearish zone, the MACD turns negative and should favor further downside for a daily close below 0.7815.
Quick note on EM
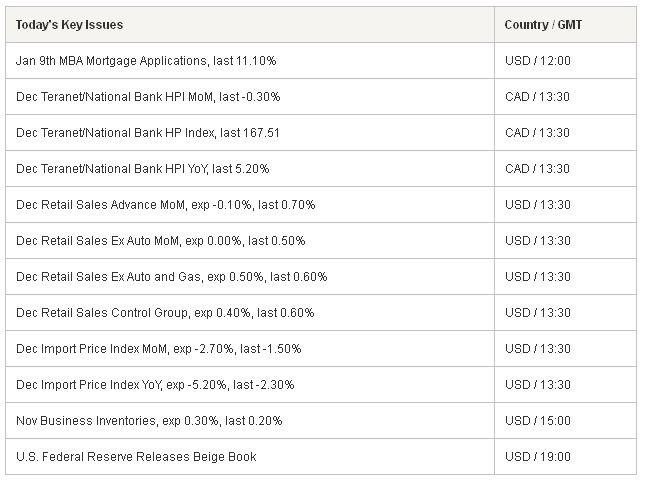
The EM currencies trade mixed as risk appetite weakened on World Bank’s lower global growth forecasts. The USD/RUB rallied to 66.5168 as WTI crude continues sliding, while the oil importers as TRY and BRL were better bid. The deterioration in Turkey current account (-5.64bn in November) saw little reaction from the market as it has been broadly interpreted as temporary due to sudden hike in gold imports. In the coming months, the short-term distortion in November figures should smoothen and we should see further contraction in the current account deficit. This suggests that the pressures on lower rates will certainly continue and the central bank will be constraint to cut rates sometime in the first quarter. USD/TRY rebounds from the 50-dma last hit on December 5th, trend and momentum indicators are favorable for deeper downside correction. The pair tests 2.2787/98 (50-dma / Fib 61.8% on May/Dec’14 rally), if broken should head down to 2.2382/2.2530 (Fibonacci 50% on May-December rally / 100-dma).
In Brazil, the new finance minister Levy said the fiscal policy should decrease the need for higher Selic, as it should curb consumer demand thus temper the inflation at alarming levels above the BCB target zone (4.5% +/-2%). Relatively lower rate increases should help attracting investors, therefore boost the growth. The theory is nice, while Rousseff’s government will need to make sure that the fiscal consolidation happens in growth-friendly manner. The BCB will give policy verdict on January 21st and is expected to increase the Selic rate by an additional 50 basis points to 12.25%. Higher rate expectations should keep the BRL attractive. USD/BRL tests the Fibonacci 76.4% level on July / December rally (2.6253). A break below should open the way for 2.5375/2.5420 (Dec support / Fib 61.8%).
EUR/USD offered post-ECJ advise


The Risk Today
Luc Luyet
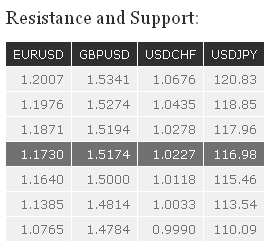
EUR/USD: EUR/USD has thus far successfully tested the support at 1.1754, suggesting a potential short-term double-bottom formation. However, a break of the hourly resistances at 1.1871 is needed to confirm such scenario. Another hourly resistance lies at 1.1976. A key support stands at 1.1640. In the longer term, the break of the strong support area between 1.2043 (24/07/2012 low) and 1.1877 (07/06/2010 low) confirms the underlying bearish trend. The long-term symmetrical triangle favours further significant weakness. Key supports can be found at 1.1640 (15/11/2005) and 1.0765 (03/09/2003 low), whereas a key resistance stands at 1.2252 (25/12/2014 high).
GBP/USD: GBP/USD has broken the hourly resistance at 1.5194 (12/01/2015 high), opening the way for a longer rebound. Another hourly resistance lies at 1.5274 (see also the 38.2% retracement). Hourly supports can now be found at 1.5143 (intraday low) and 1.5035, while a psychological support stands at 1.5000. In the longer term, the technical structure is negative as long as prices remain below the key resistance at 1.5620 (31/12/2014 high). A full retracement of the 2013-2014 rise is expected. A strong support lies at 1.4814 (09/07/2013 low).
USD/JPY USD/JPY continues to weaken. A break of the hourly resistance at 117.96 (intraday high) is needed to suggest some exhaustion in the short-term selling pressures. Another hourly resistance can be found at 118.85 (13/01/2015 high, see also the declining channel). A key support stands at 115.46. A long-term bullish bias is favoured as long as the key support 110.09 (01/10/2014 high) holds. Even if a medium-term consolidation is likely underway, there is no sign to suggest the end of the long-term bullish trend. A major resistance stands at 124.14 (22/06/2007 high). A key support can be found at 115.46 (17/11/2014 low).
USD/CHF USD/CHF has failed thus far to break the hourly resistance at 1.0217. As a result, a break of the hourly support at 1.0118 (12/01/2015 low) would validate a short-term double-top formation. Another hourly support lies at 1.0033. The break of the major resistance area between 0.9972 (24/07/2012 high) and 1.0067 (01/12/2010 high) confirms that a new long-term uptrend has started in August 2011. A new long-term rising phase echoing the one made from August 2011 to July 2012 is likely underway. Key resistances stand at 1.0676 (12/07/2010 high) and 1.1731 (01/06/2010 high), whereas a key support can be found at 0.9831 (25/12/2014 low).

