Upcoming US Events for Today:
- ADP Employment Report for May will be released at 8:15am. The market expects payrolls to increase by 210,000 versus 220,000 previous.
- International Trade for April will be released at 8:30am. The market expects a deficit of $41.0B versus $40.4B previous.
- Non-Farm Productivity for the First Quarter will be released at 8:30am. The market expects a quarter-over-quarter decline of 2.9% versus a decline of 1.7% previous.
- ISM Non-Manufacturing Index for May will be released at 10:00am. The market expects 55.3 versus 55.2 previous.
- Weekly Crude Inventories will be released at 10:30am.
The Markets
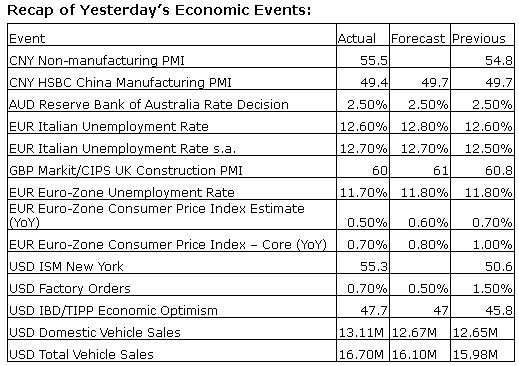
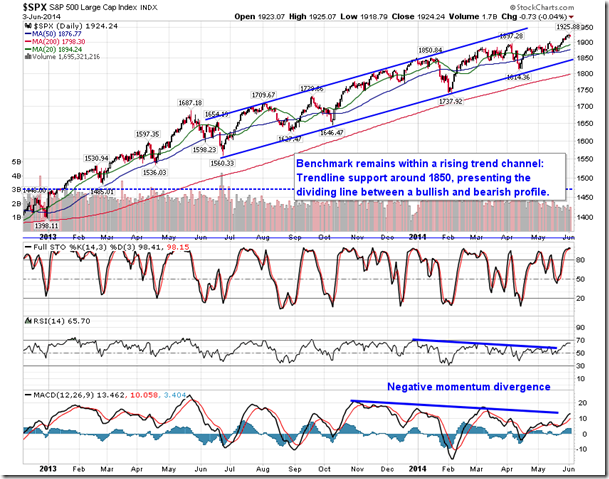
Stocks ended marginally lower on Tuesday as investors wait for further clues pertaining to monetary policy with the ECB scheduled to announce on Thursday. Investors have come to expect the ECB to announce another cut in rates from the already historically low levels as the central bank attempts to thwart the threat of deflation. The anticipation has fuelled bond market gains around the globe, pushing yields in a number of countries to multi-year lows. Thursday’s ECB event is likely to be a significant market mover.
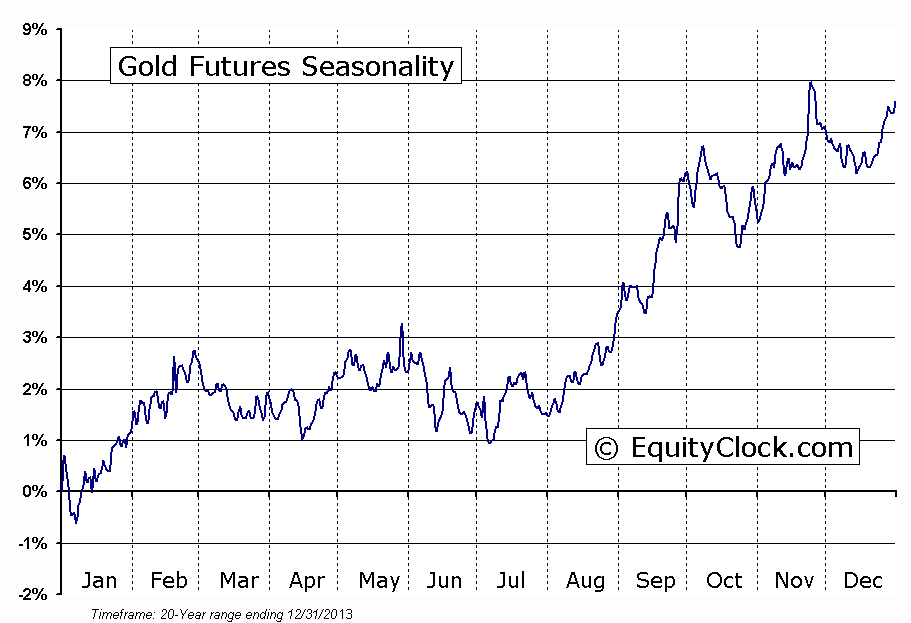
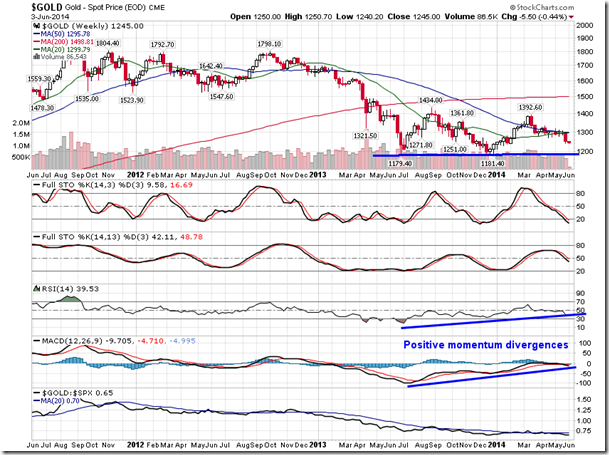
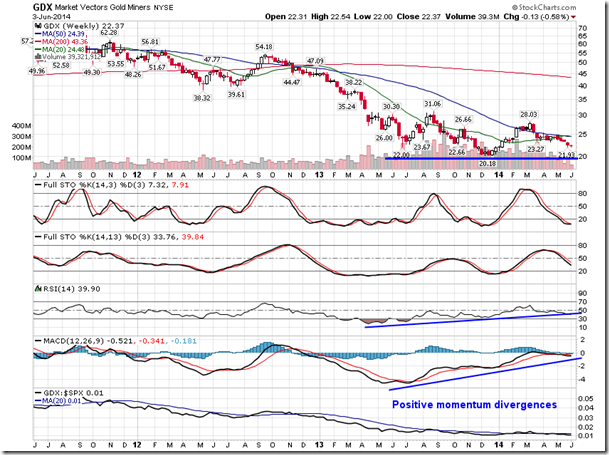
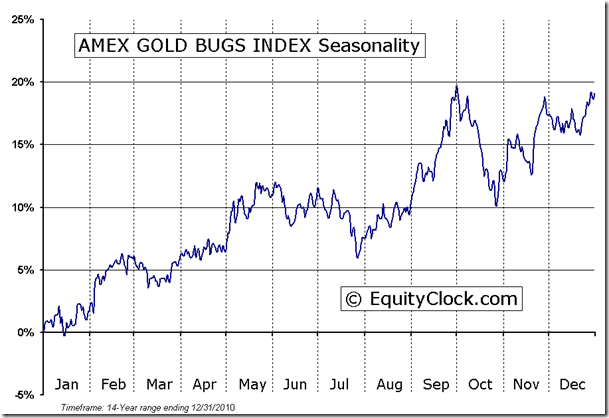
One of the more profitable and consistent seasonal trades in the year is the Gold trade, which spans from the start of July through to the start of October, on average. Gold bullion has gained around 6%, on average, while the gold mining stocks have averaged a gain of 14%. Gold is currently the most oversold since June of last year, just prior to the bounce that ran through to the end of September; the commodity posted a gain of over 21% from through to peak, bringing an end to a substantial negative trend that began in September of 2012. The commodity is arguably in a long-term base building pattern with support remaining apparent at last June’s low of 1179.40. On the weekly chart, momentum indicators have already started to positively diverge from the price action, hinting of a positive move ahead. The Market Vectors Gold Miners ETF(ARCA:GDX) is showing a similar base building pattern with support around $20. Should levels of support continue to hold, look for healthy gains through the period of seasonal strength ahead.
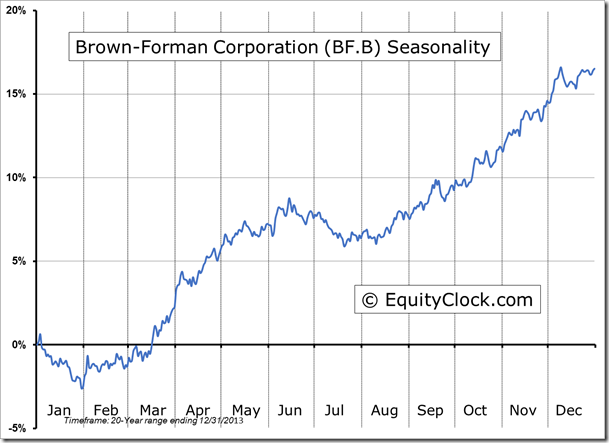
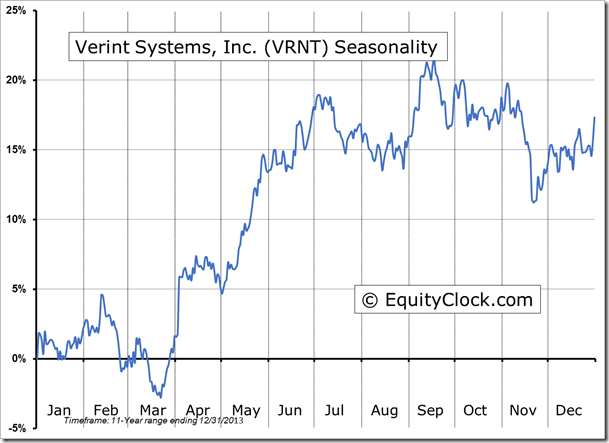
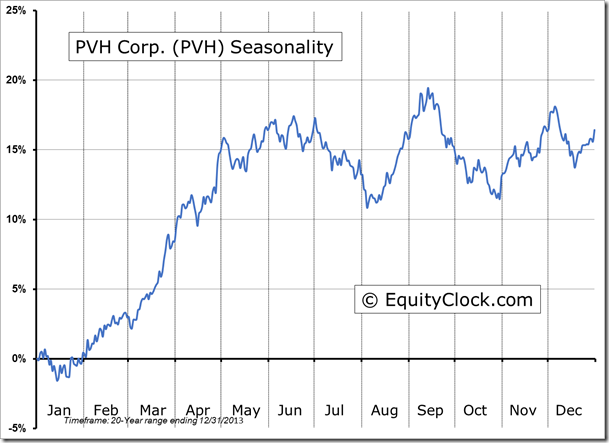
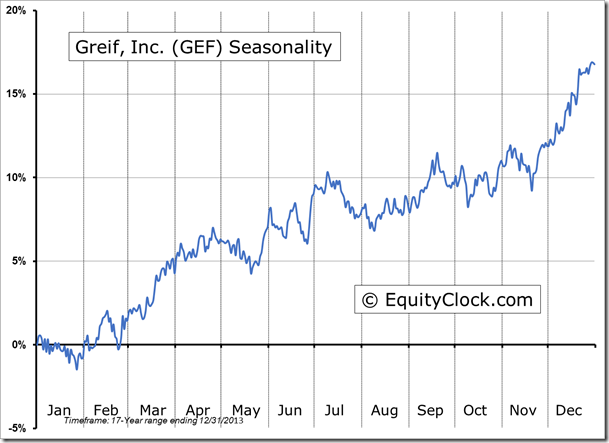
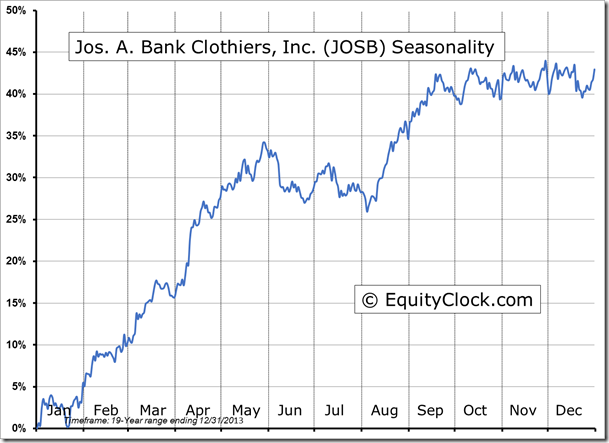
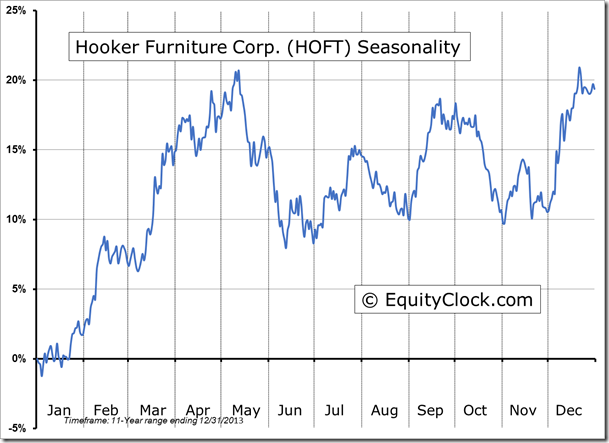
Seasonal charts of companies reporting earnings today:
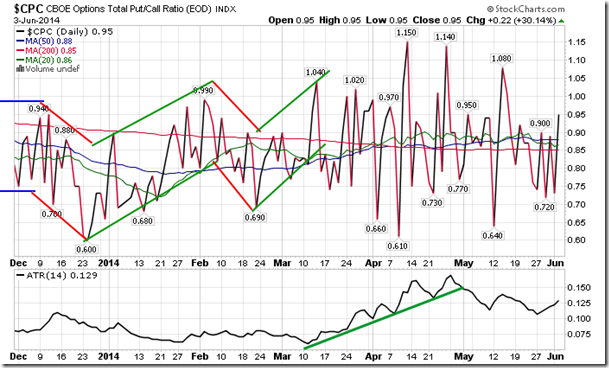
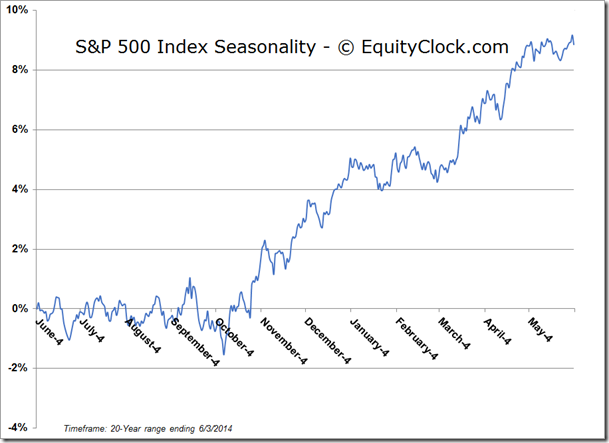
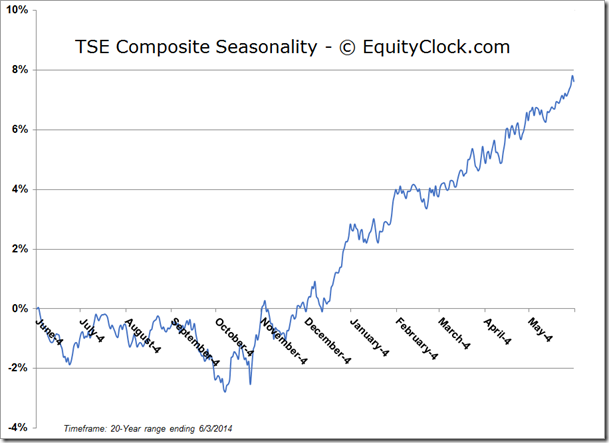
Sentiment on Tuesday, according to the put-call ratio, ended close to neutral at 0.95.
S&P 500 Index
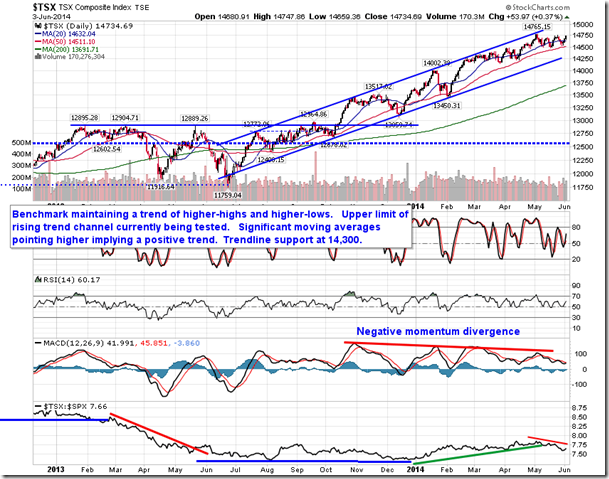
TSE Composite
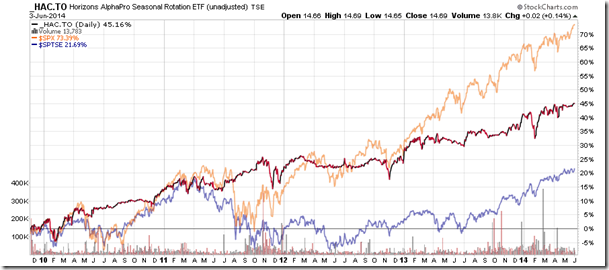
Horizons Seasonal Rotation ETF (TSX:HAC)
- Closing Market Value: $14.69 (up 0.14%)
- Closing NAV/Unit: $14.67 (down 0.02%)
Performance*
| 2014 Year-to-Date | Since Inception (Nov 19, 2009) | |
| HAC.TO | 2.59% | 46.7% |
* performance calculated on Closing NAV/Unit as provided by custodian