
Quick Take
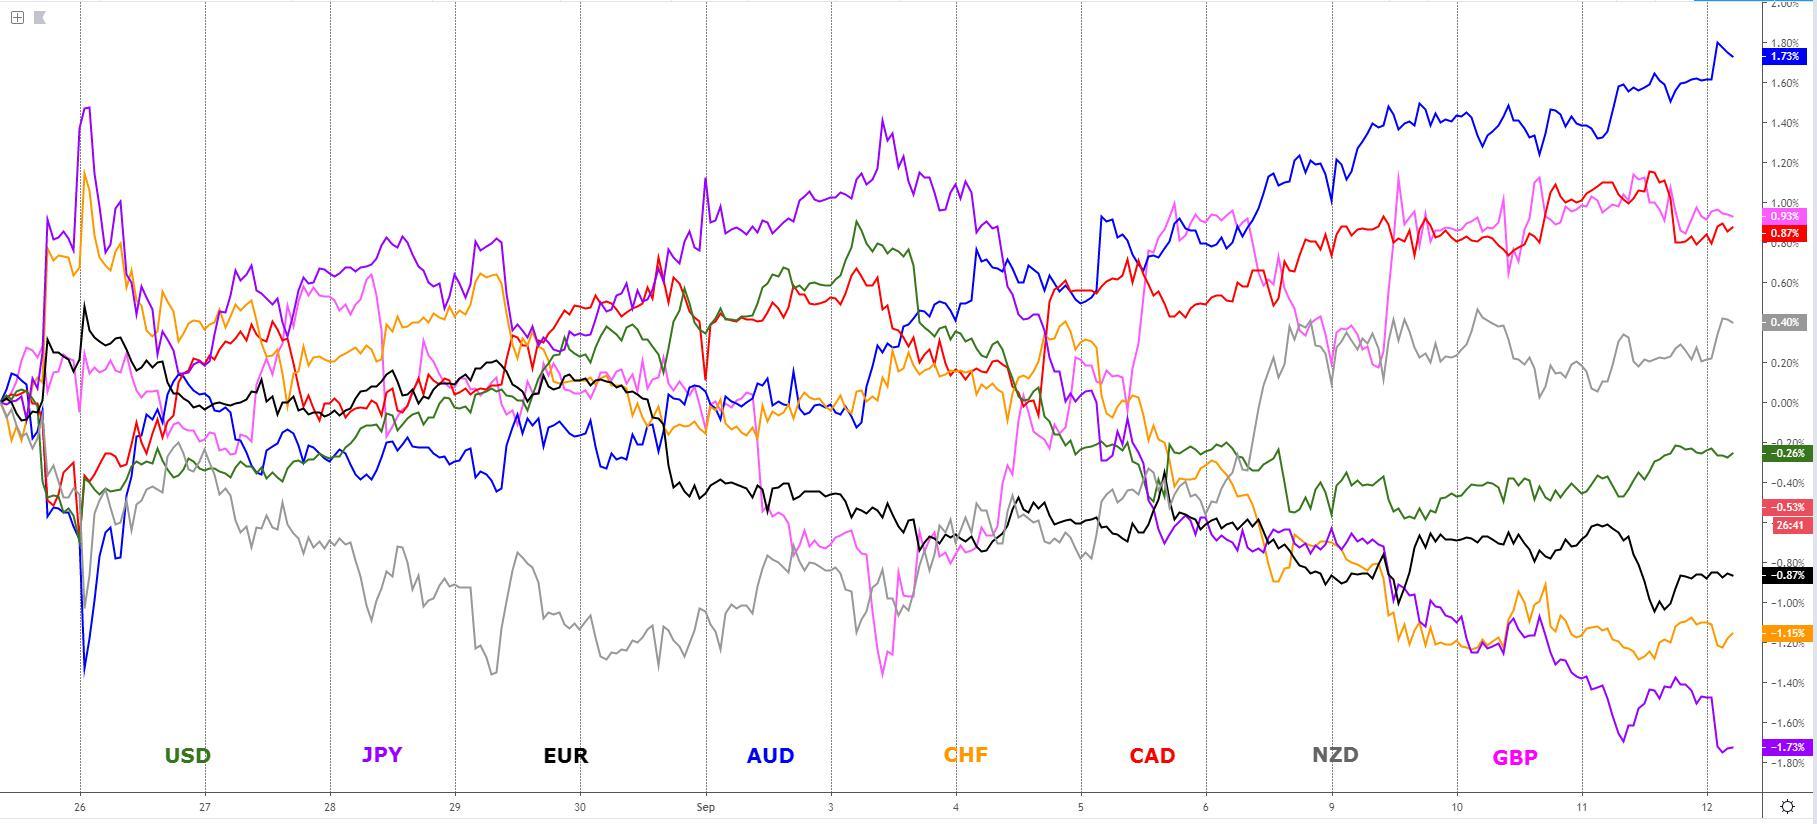
The euro heads into today's crucial ECB meeting, which marks the end of Draghi's tenure as President, with the downside pressure intact as the equally-weighted EUR index retests the very same low that led to the latest resurgence in the single currency's demand the day of the last ECB meeting. Coincidence that we find the euro in the same levels of sentiment as back when the ECB last met on July 25th? I wouldn't say so as the valuation of the EUR is highly dependable on the ECB policy outlook, and since that last meeting, the preponderance of fundamental evidence for the ECB to act decisively has only strengthened, which is precisely what the market has been discounting ahead of it, therefore traders should accept as a premise to see further EUR weakness an over-delivery of policies by the ECB unless we see a similar rebounding episode akin to what transpired after the last ECB decision. Will the ECB announce a new QE program? What will be the size of it? Are they going to cut the deposit rate? by 10bp or 20bp? These are some of the most pressing 'question marks' the market needs clarity on, and by which the EUR will determine its next directional bias. On the rest of the G8 FX space, we have the Oceanic currencies, especially the Aussie, still flying as Trump delays tariffs to China from Oct 1 to Oct 15 in a goodwill gesture, while the funding-type currencies (JPY, CHF) remain on the backfoot with further downside in the horizon as the 'risk-on' dynamics stand. The USD is starting to find renewed buy-side pressure, which is the opposite of what we've seen in the CAD market in the last 24h even if the outlook remains quite promising. The sterling has been rather comatose as the Brexit newsflow slows down.
Narratives In Financial Markets
* The Information is gathered after scanning top publications including the FT, WSJ, Reuters, Bloomberg, ForexLive, Institutional Bank Research reports.
Core bond yields hold gains ahead of the ECB: Global bond yields in developed markets (DM) have consolidated gains ahead of the crucial ECB policy meeting later today, while equities in the US and Europe head higher as the lingering effects of the quadfecta of positive news continues (HK, Brexit, US-China trade, Italian politics).
Oil sell-off driven by Iran developments: Oil has found follow-through selling interest after the abrupt reversal off its high in a fundamentally-driven move following the news that the reason that Bolton was fired as National Security Advisor earlier this week may have to do with a disagreement with Trump over the President’s considerations to ease sanctions and restart talks with Iran, which would include a meeting with the President of Iran Rouhan, who replied talks may follow under the premise that the US lifts the sanctions. This piece of news is also a contributor to the benign bid in risk.
China's sounding board revitalizes risk trades: According to a tweet by Global Times editor-in-chief, Hu Xijin, who acts as China’s government sounding board, China will introduce important measures to ease the negative impact of the trade war, stating that “based on what I know, China will introduce important measures to ease the negative impact of the trade war. The measures will benefit some companies from both China and the US." The headline, no doubt, reinforced the positive tone on Wednesday.
Trump adds to the 'risk-on' by delaying tariffs: In a tweet published just an hour ago in the Asian session on Thursday, Trump has confirmed the delay of a tariff increase to China for 2 weeks to October 15 instead of October 1. The headline has given a decent jolt to risk assets, most notably the Aussie and equities. The tweet read: “At the request of the Vice Premier of China, Liu He, and due to the fact that the People's Republic of China will be celebrating their 70th Anniversary on October 1st, we have agreed, as a gesture of goodwill, to move the increased Tariffs on 250 Billion dollars worth of goods (25% to 30%), from October 1st to October 15th.”
Another tweet against Fed policies by Trump: Trump takes it on the Fed once again, tweeting that the Fed should cut rates to zero or less: “The Federal Reserve should get our interest rates down to ZERO, or less, and we should then start to refinance our debt. INTEREST COST COULD BE BROUGHT WAY DOWN, while at the same time substantially lengthening the term. We have the great currency, power, and balance sheet. The USA should always be paying the lowest rate. No Inflation! It is only the naïveté of Jay Powell and the Federal Reserve that doesn't allow us to do what other countries are already doing. A once in a lifetime opportunity that we are missing because of "Boneheads."
ECB commands all the attention today: All the attention will shift to the ECB meeting today, with the announcement due at 11:45 GMT and the subsequent presser by Draghi at 12:30 GMT, which will be his last before being officially replaced by the new incoming President and former IMF Director Lagarde.
What to expect by the ECB? The consensus among economists is for a 10bp cut to the ECB's deposit rate. However, with the market pricing in 14bps of rate cuts, it implies a 50% chance that the ECB could cut by 20bps. A restart of QE of about €30b per month of bond buying as a median estimate is also expected. The size of the program will be a key driver in the euro valuation today. A "tiering" system for bank reserves to mitigate the implications of negative rates in the banking sector could also be a strategy adopted by the ECB today.
Risk of disappointment in today's decision Judging by the sharp fall in the euro over the last few weeks, the price action communicates the ECB must overdeliver to keep the sell-side pressure. It’s worth noting that given the large number of ECB council members opposing a new QE program, the ECB may disappoint by letting the cat out of the bag by pre-announcing a QE program, but it won’t necessarily make it official in today’s meeting, which would be a major boost for the euro in the short-term.
Recent Economic Indicators And Events Ahead
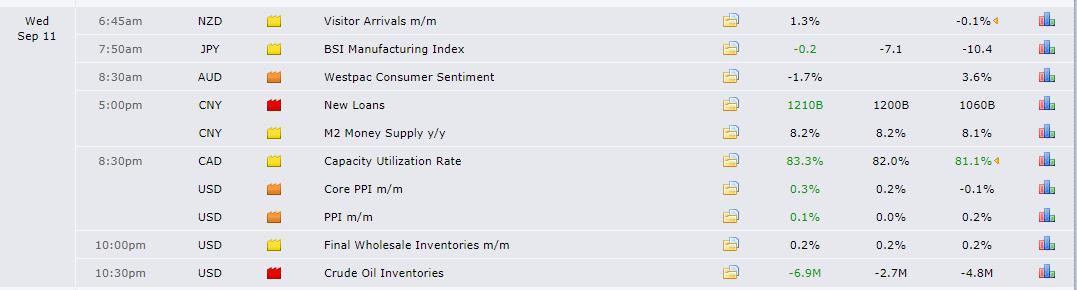
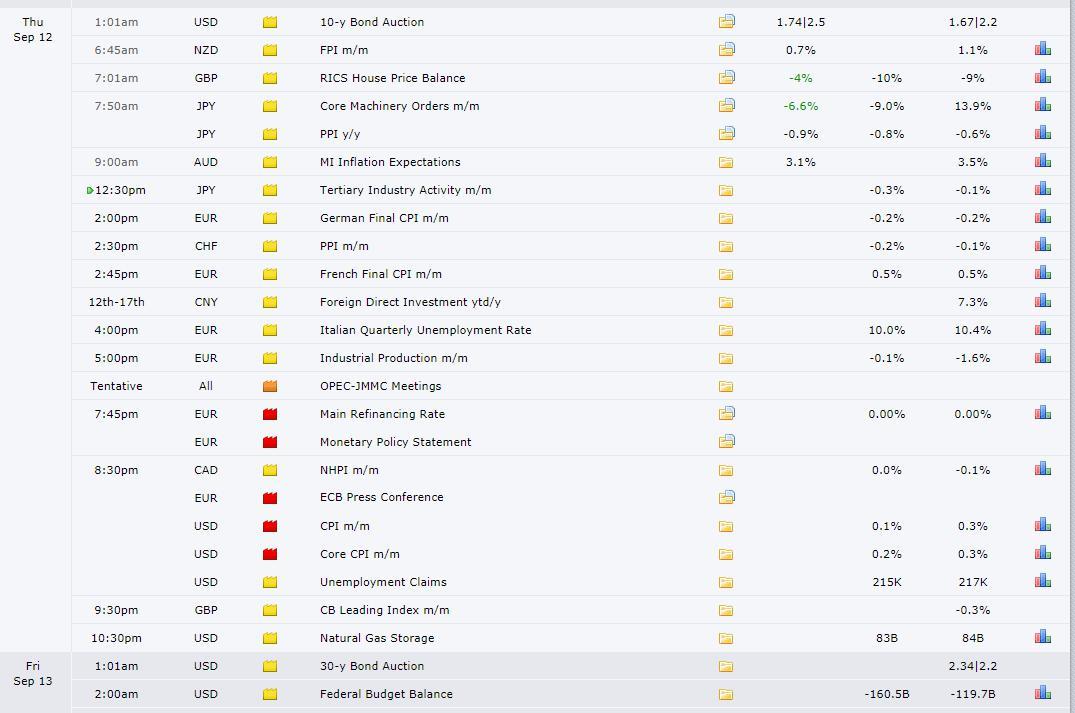
Source: Forexfactory
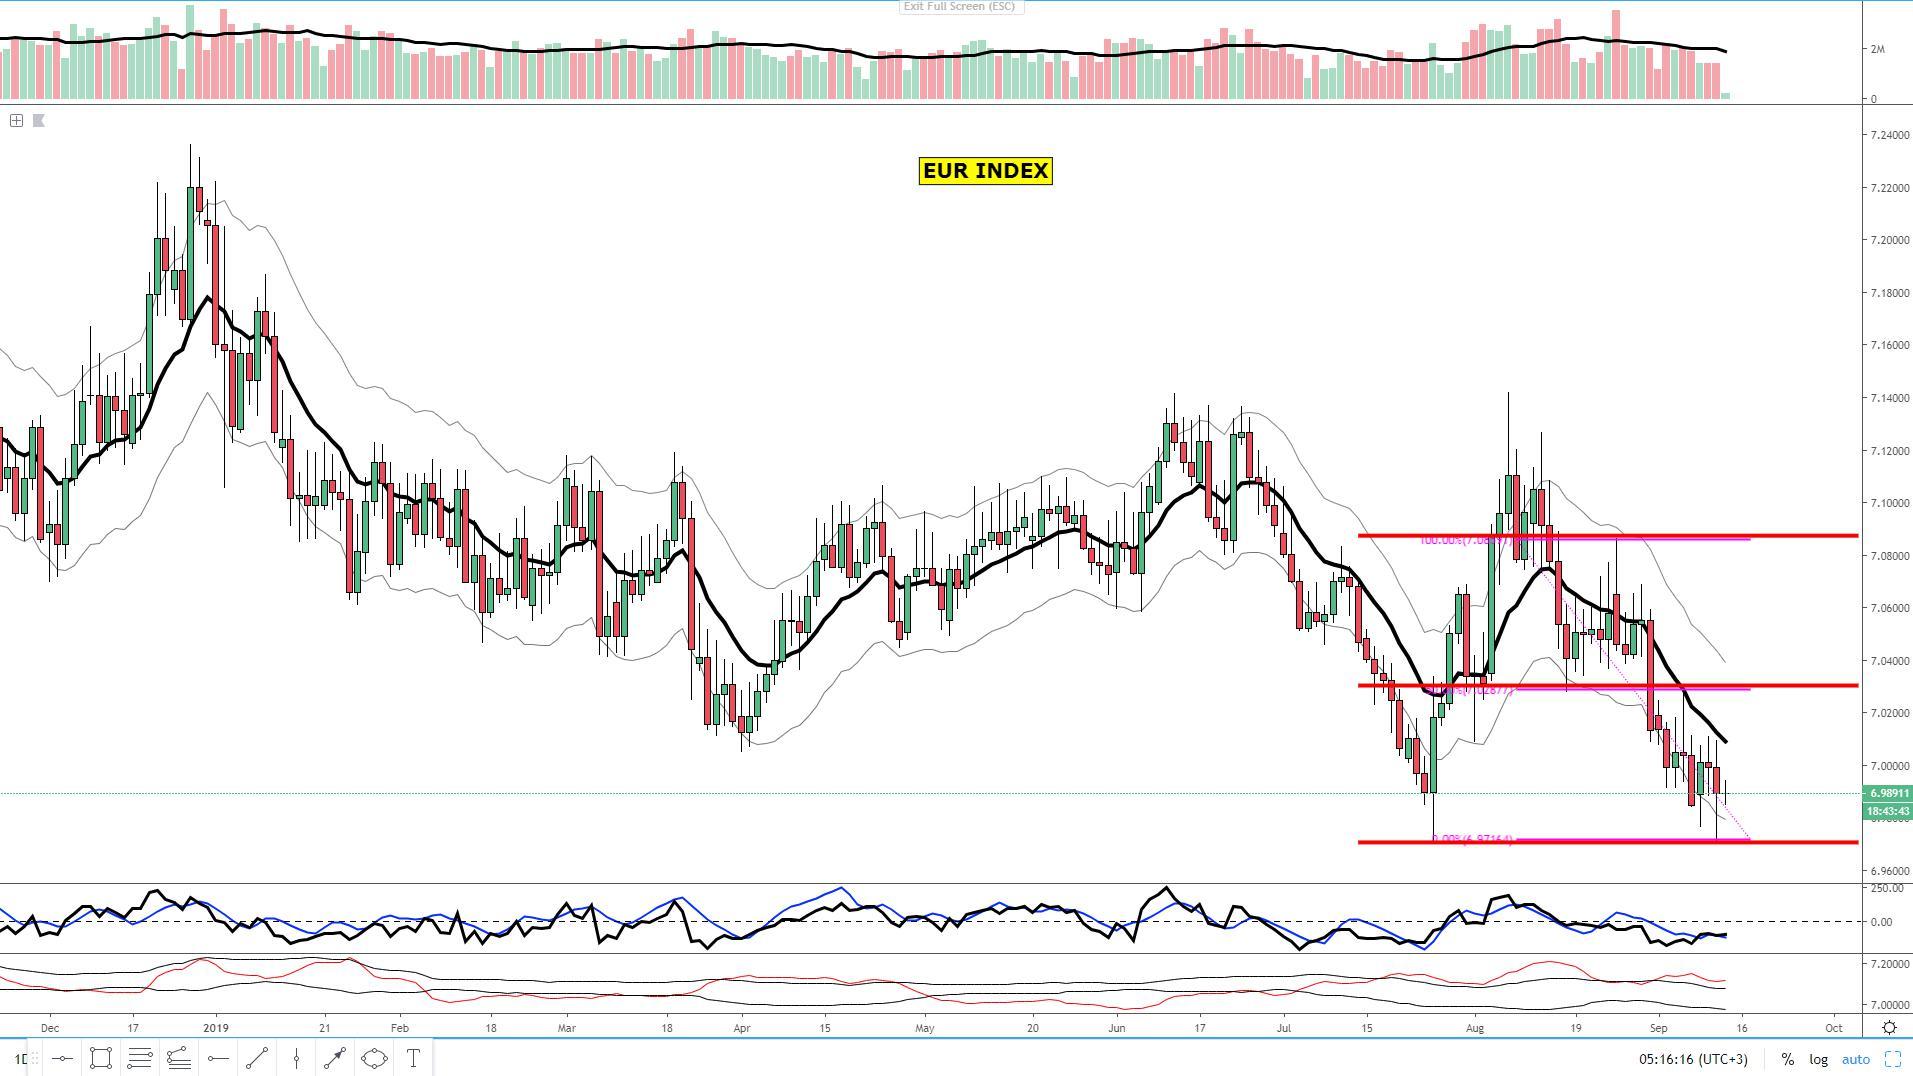
A Dive Into The Charts
The EUR index made a marginal new low before finding further buying interest at the confluent 100% proj target + horizontal support. Remember, it is no coincidence that we see the performance of the EUR against G8 FX improve the moment these key areas get tested in this equally-weighted hybrid index which as I reiterated many times, allows us to read the overall sentiment and identify pristine locations to take technically-led action based on historical data. Heading into the ECB, the euro is clearly in a bearish trend and the next directional bias will be subject to the fundamental interpretation the market makes of the new set of tools the ECB will deploy in order to stimulate the European economy. The larger the size the ECB commits to its anticipated restart of the QE program, alongside how deep it cuts rates, the more the euro will be pressured, even if the bar has been fairly high to keep the EUR sold on a daily closing basis.
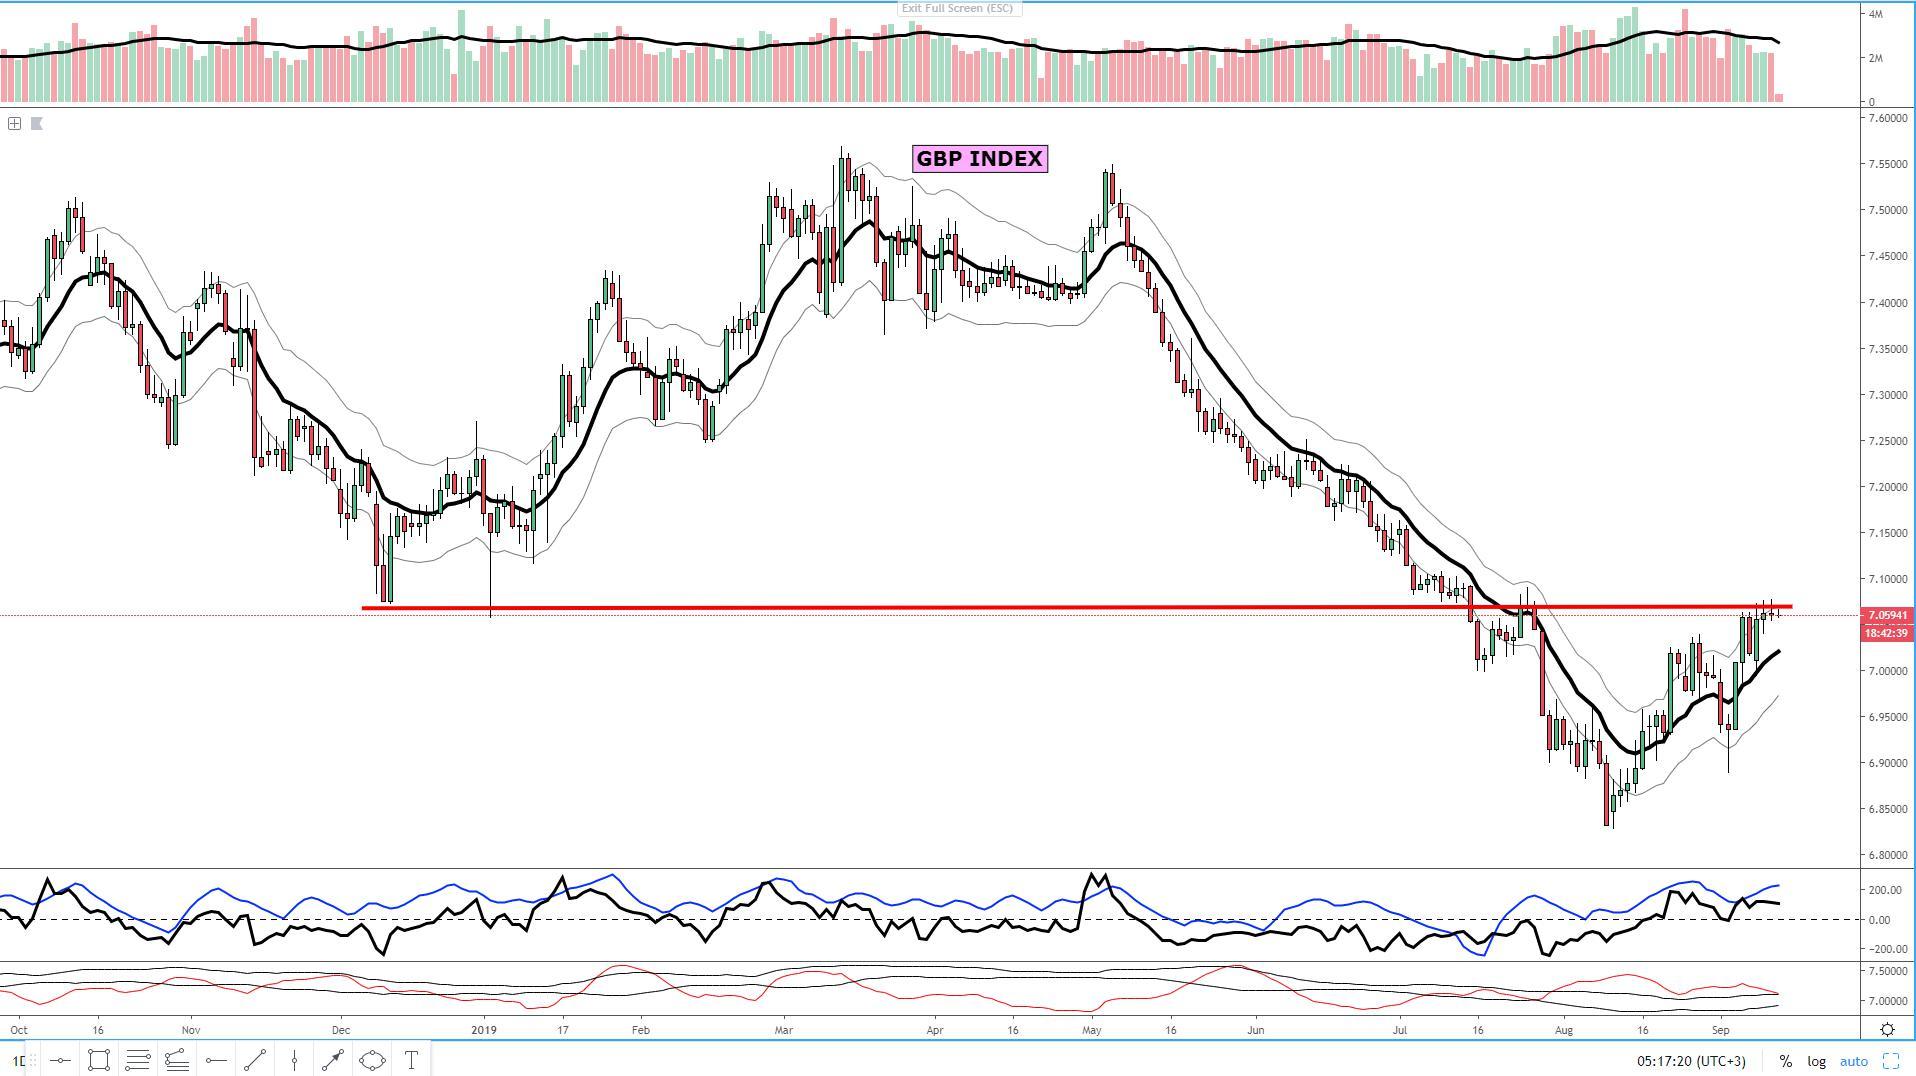
The GBP index is unchanged as the newsflows of Brexit goes in recess and markets go in standby mode ahead of the ECB. The index is currently consolidating at a major macro resistance area keeping a bullish outlook as it maintains its quote above the baseline but be aware that trading the Pound long into this block of offers depicted by the index is risky. As noted in earlier notes this week, the aggregate tick volume heading into this major resistance has been fairly poor, which makes the prospects of a breakout prior to a pullback a rather questionable outcome to expect based on my decade-long observation of this pattern.
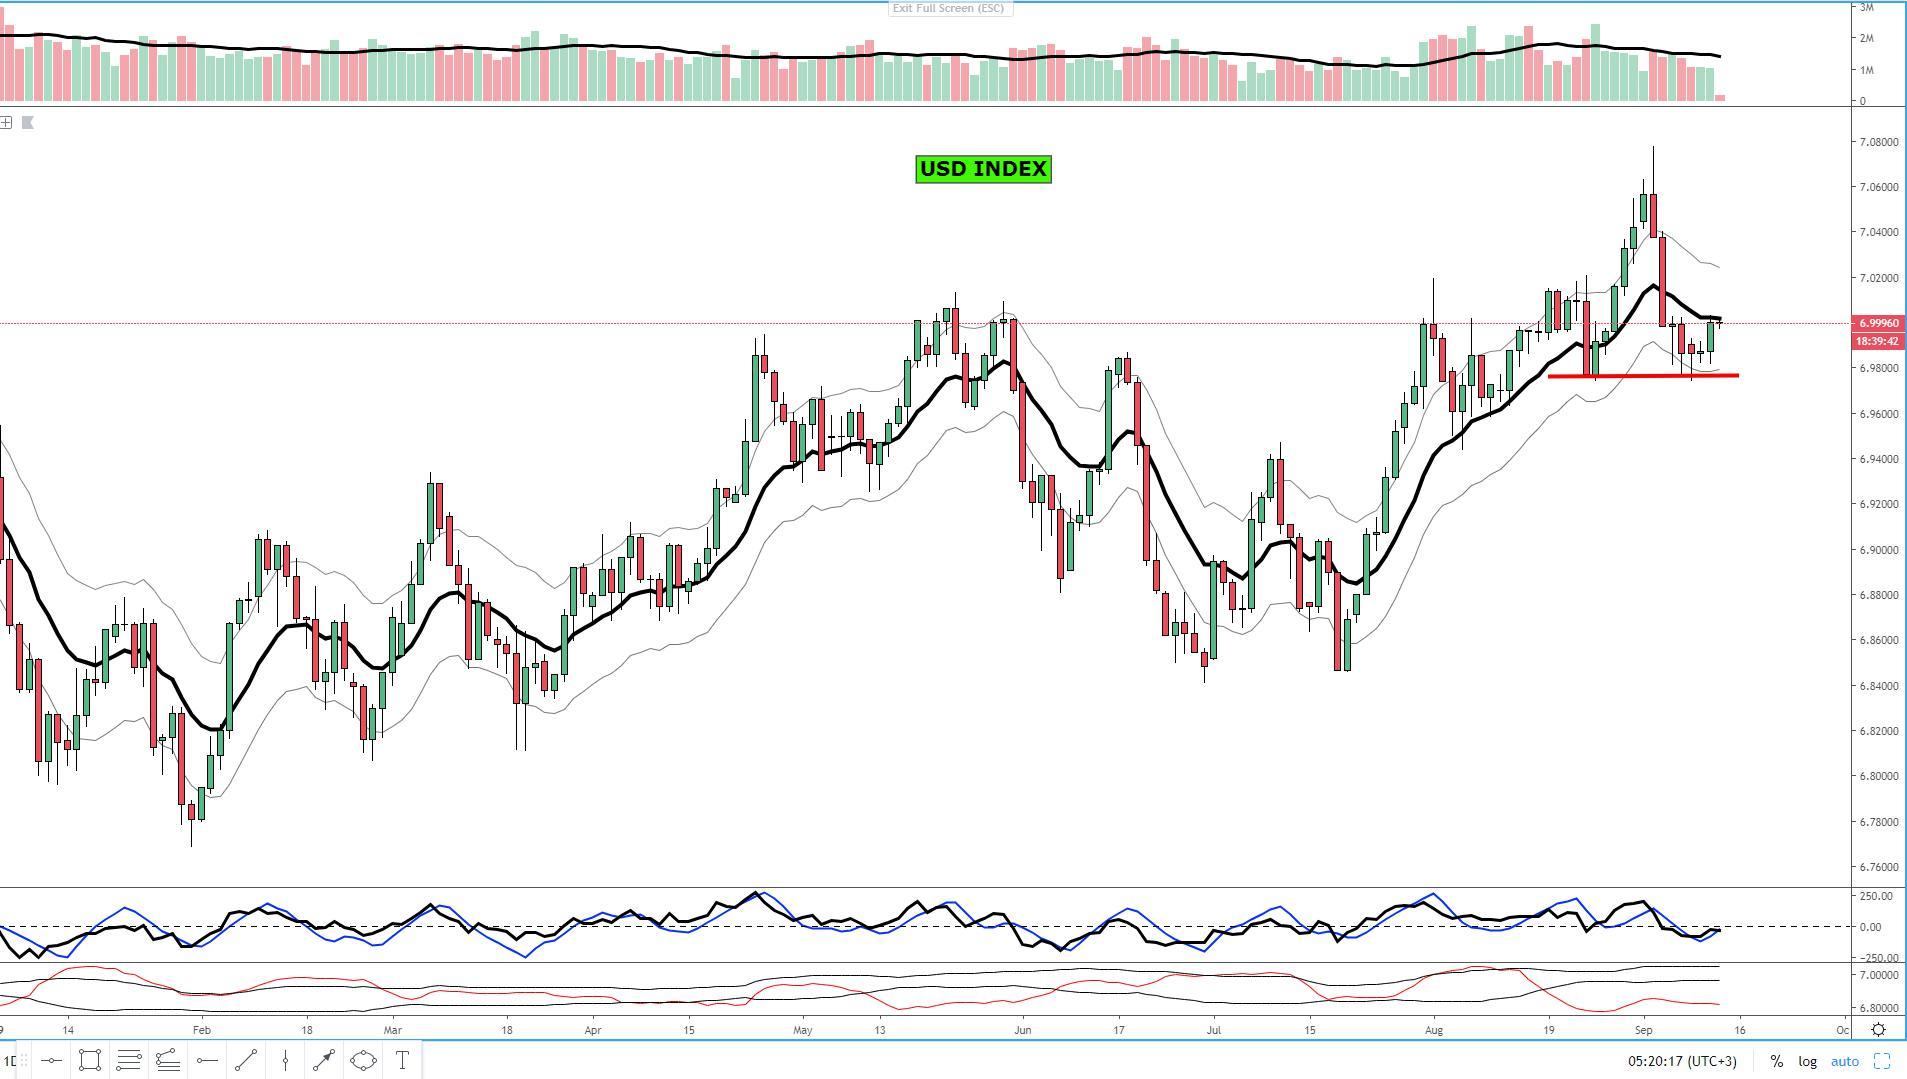
The USD index, as followers of my research know, has given us preemptive tips of caving out a potential bottom at an area that I consider to be of great technical value as it retests the previous swing low of a movement that led to a successful rotation. Should this area be violated, it would damage the structure of the index, but as long as bulls keep control, even if the baseline that delimits my official directional bias has not been re-taken yet, it makes me overall very suspicious that a resumption of the USD bull trend could be a matter of days now. The overall tick volume activity has been rather low, and understandably so, as the larger capital is sidelined until the ECB.
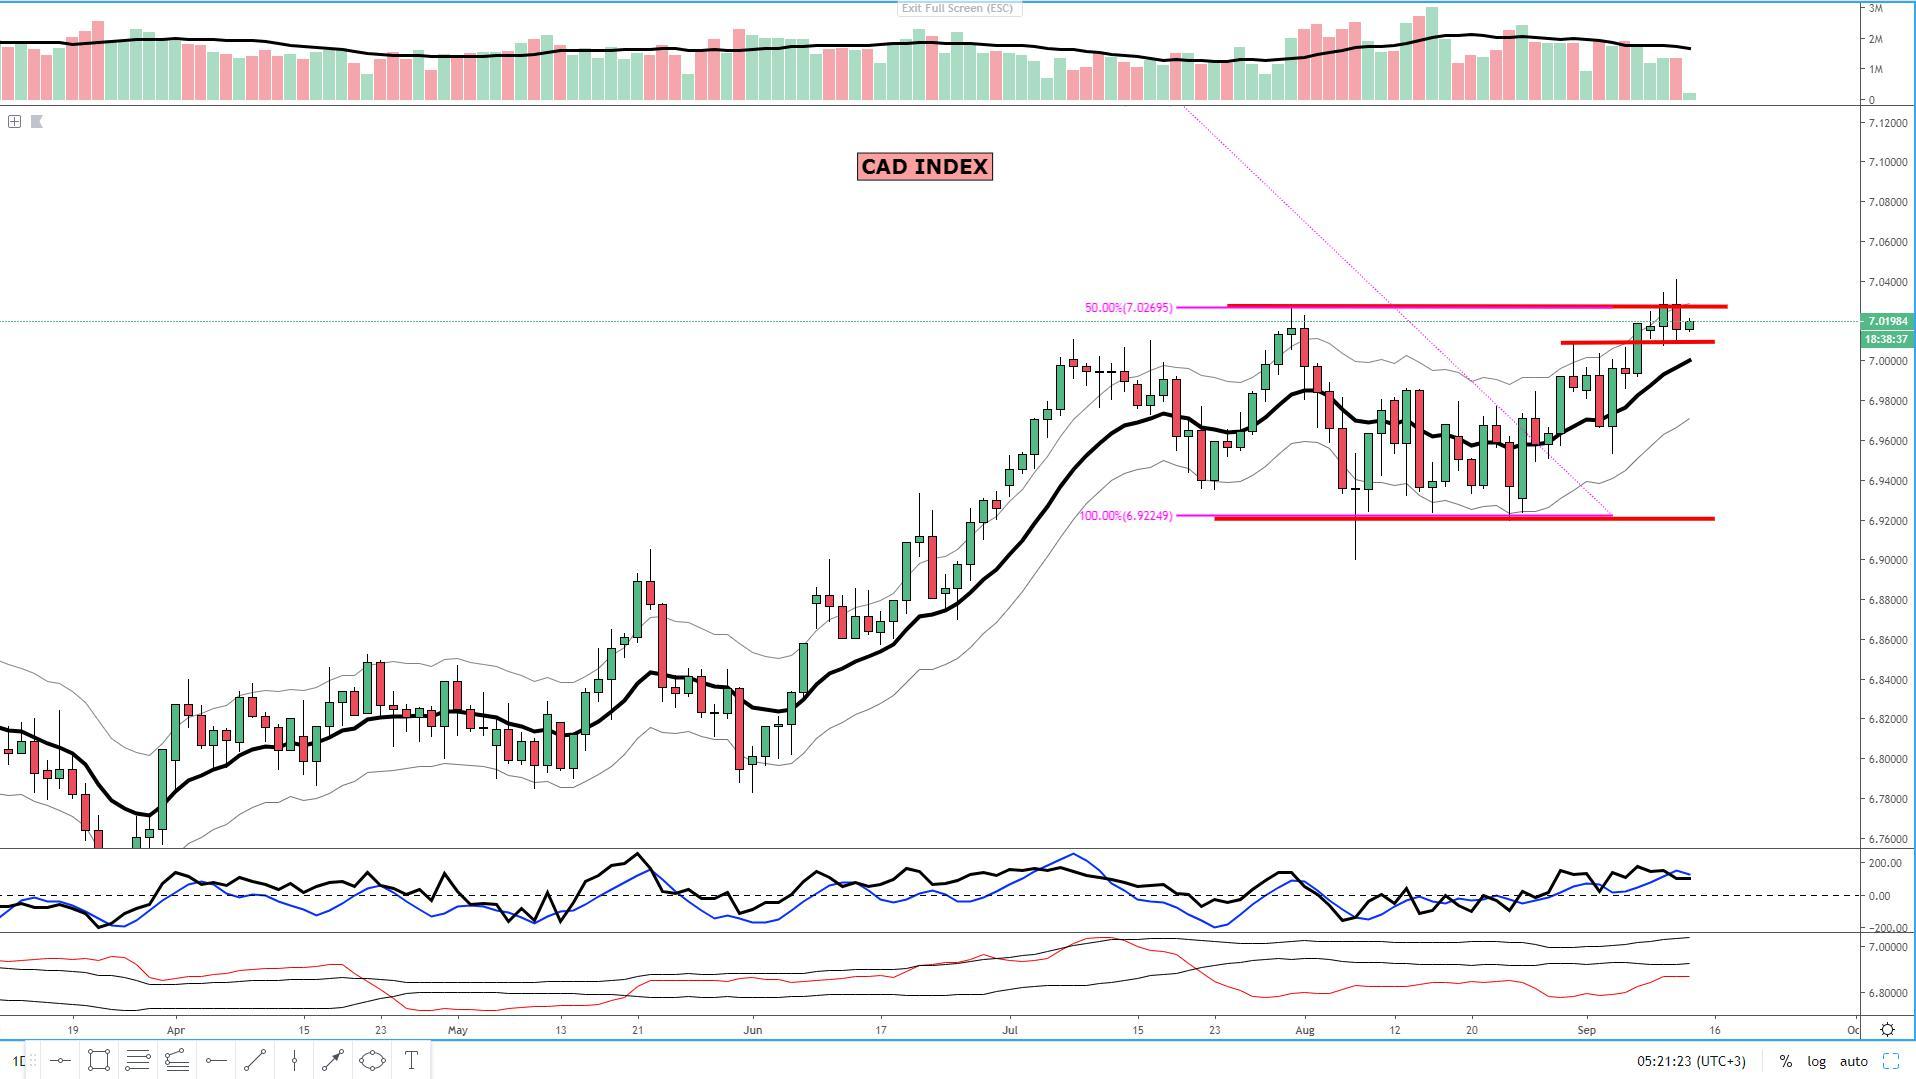
The CAD index is definitely at a very interesting juncture, not yet finding the overarching commitment to accept a valuation above its previous trend high. The index did see an early Wed breakout but failed to gather steam, leading to a retracement back to the previous swing high now turned support, which so far is acting as a support for buyers to reinstate positions, which is what one would expect if following this hybrid sentiment index. The overall outlook is bullish as price exchanges hands above the baseline, while the location to participate in longs is also quite attractive as the index is within less than 1x ATR from the baseline.
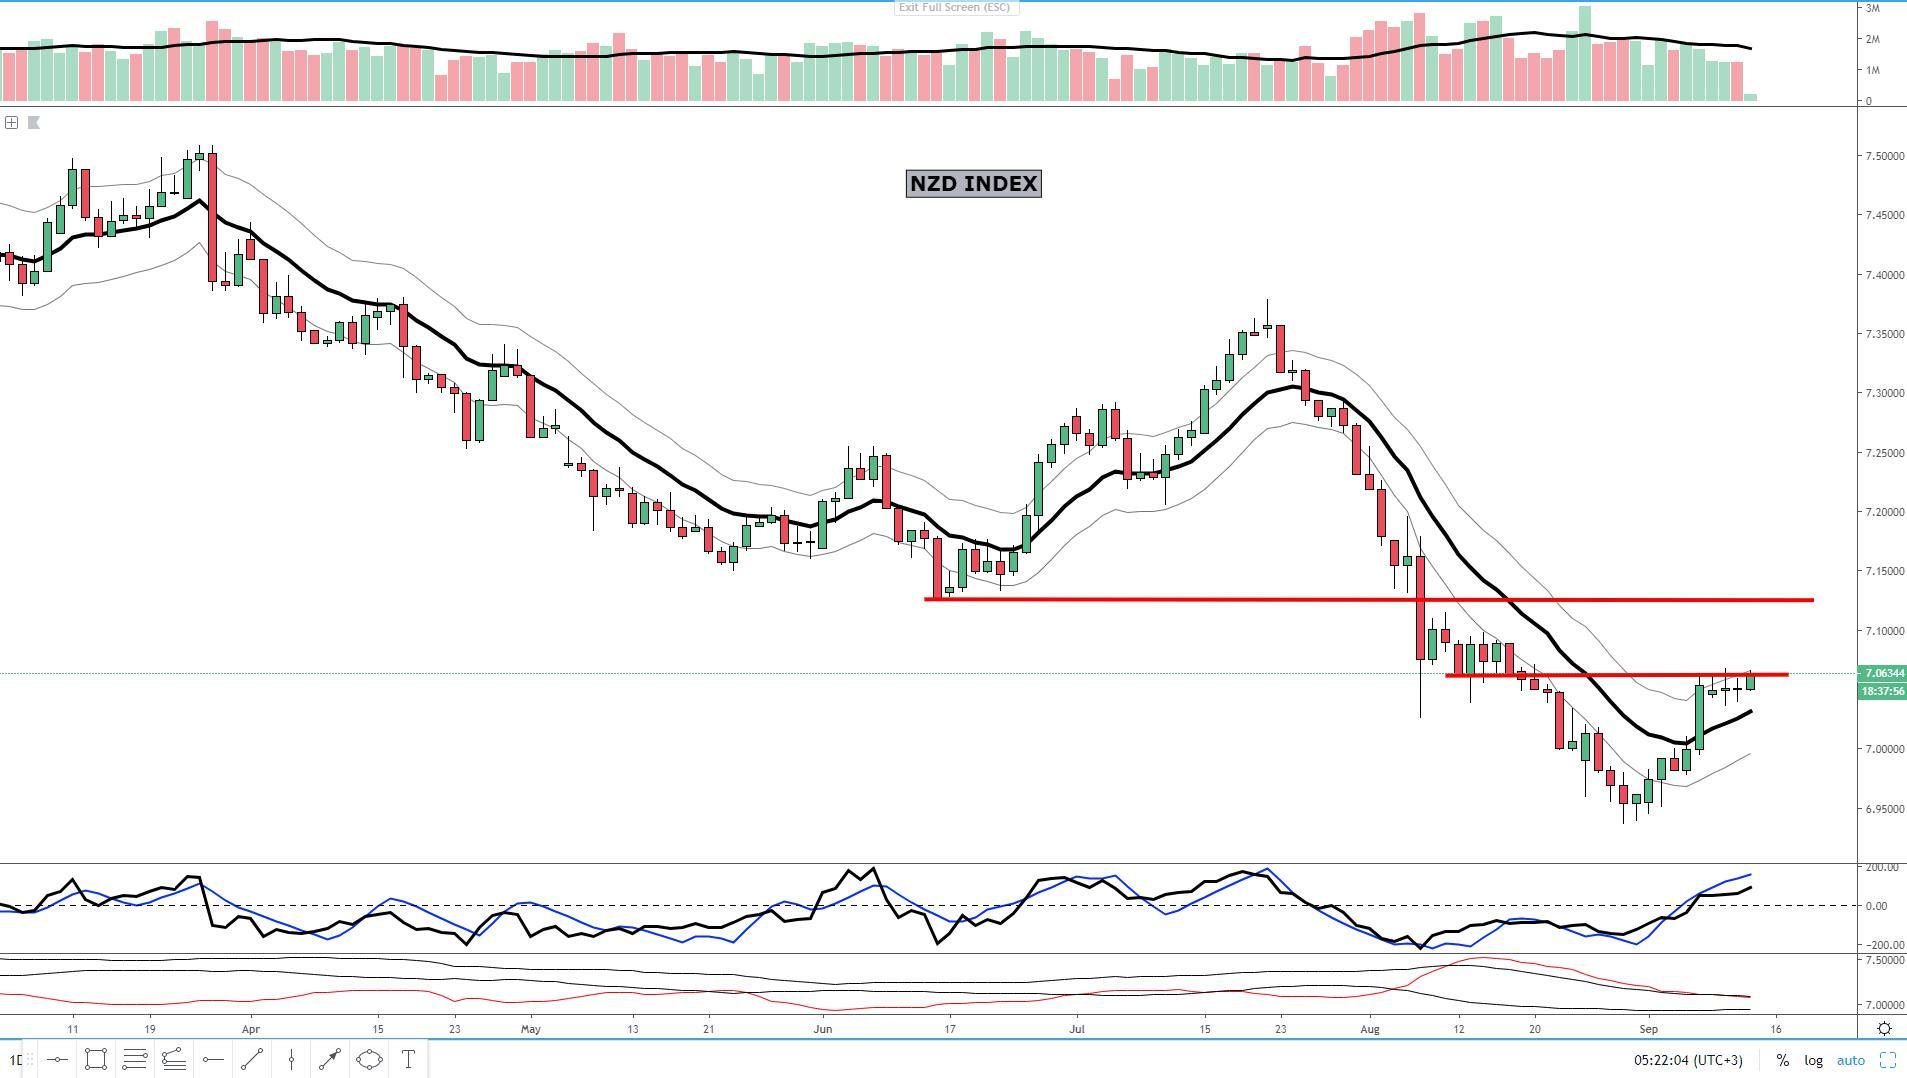
The NZD index has been capped for over a week by the same level of resistance, disallowing further gains and providing intraday short scalping opportunities in overbought Kiwi conditions. The area is being retested once again in Asian this Thursday as the positive sentiment resurfaces on the back of the delay in US tariffs to China by Trump. The outlook for the currency remains positive with no technical evidence to shift this stance when analyzing the daily.
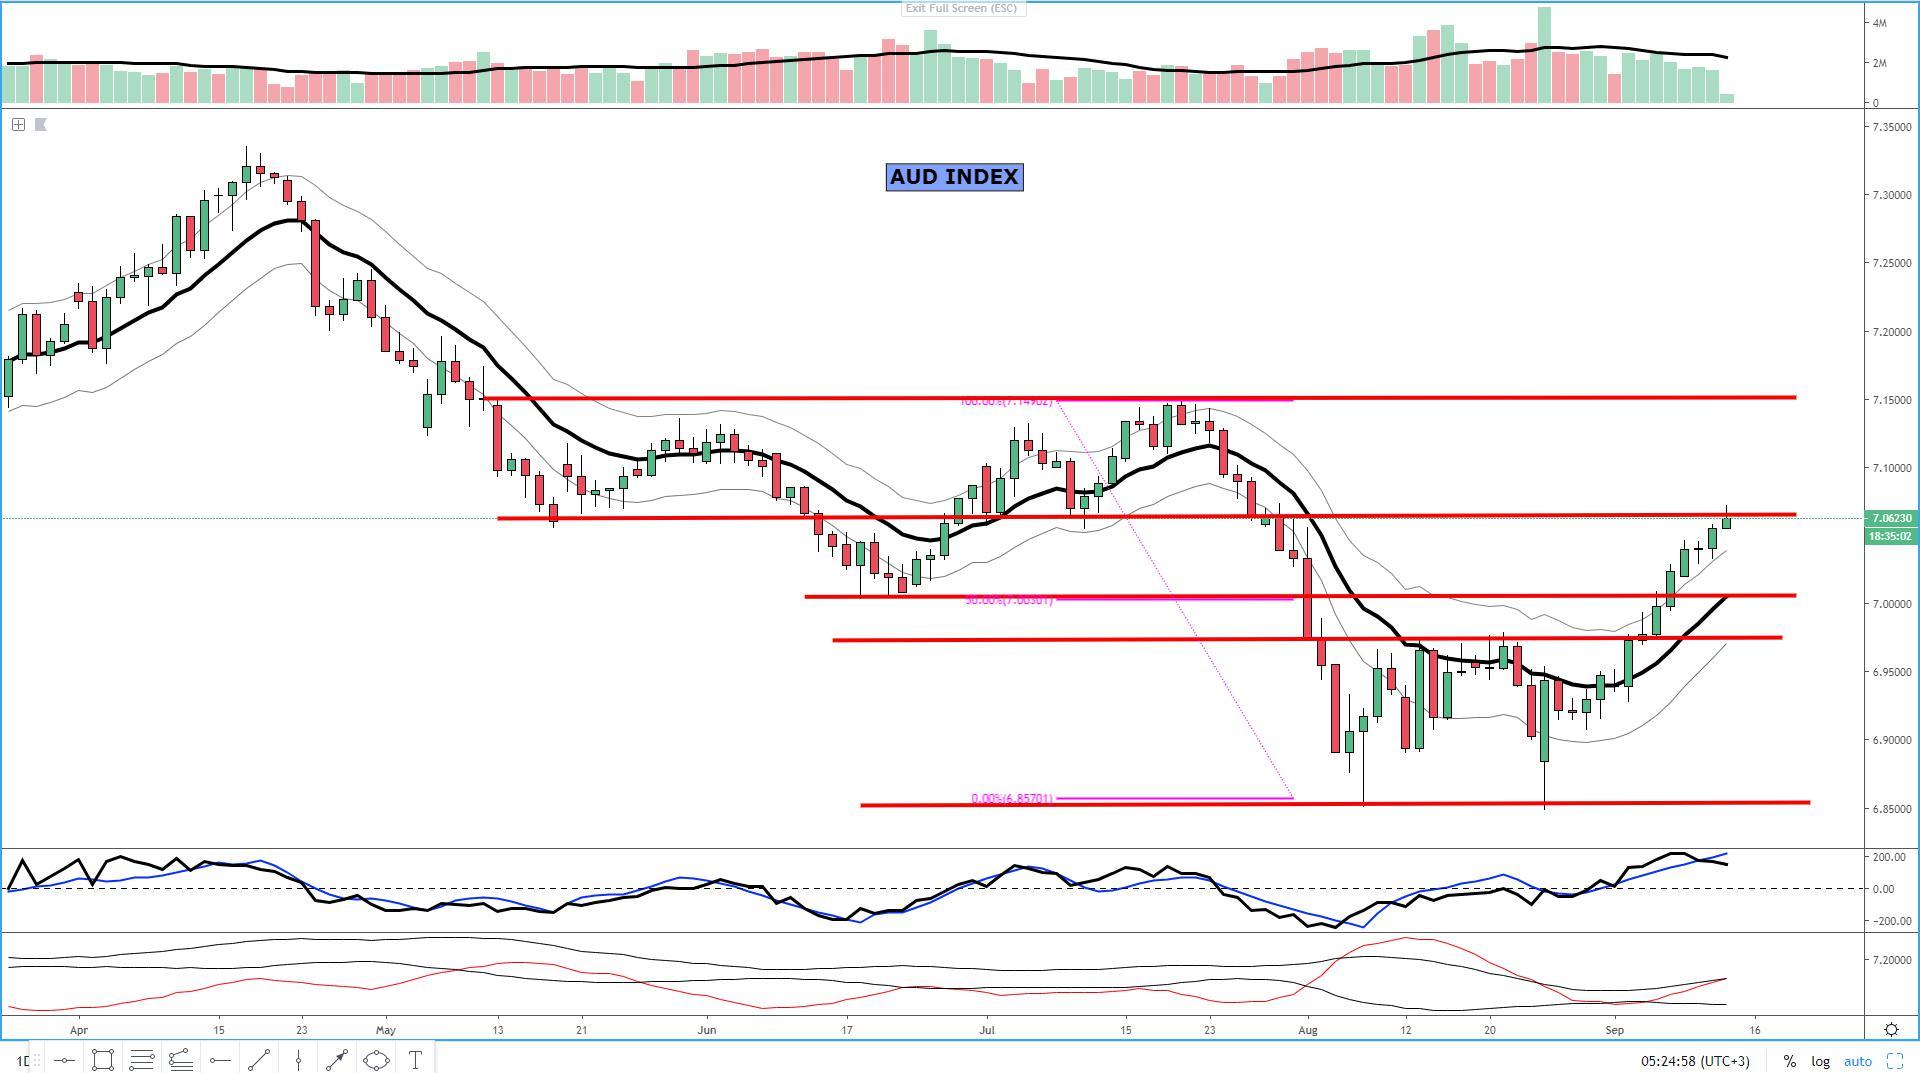
The AUD index keeps making further strides in what would be the 11th day of gains in a row if the currency ends in the green. The index stopped in its tracks at the area of macro resistance as per July 10th low, but the latest tweet by Trump delaying the tariffs to China has led to algo activity returning during a thin-liquidity period, further propelling the Aussie. As I’ve stated throughout the week, this is a market congruent to be traded by momentum strategies but awfully expensive if you are interested in finding value trades from a swing trading standpoint.
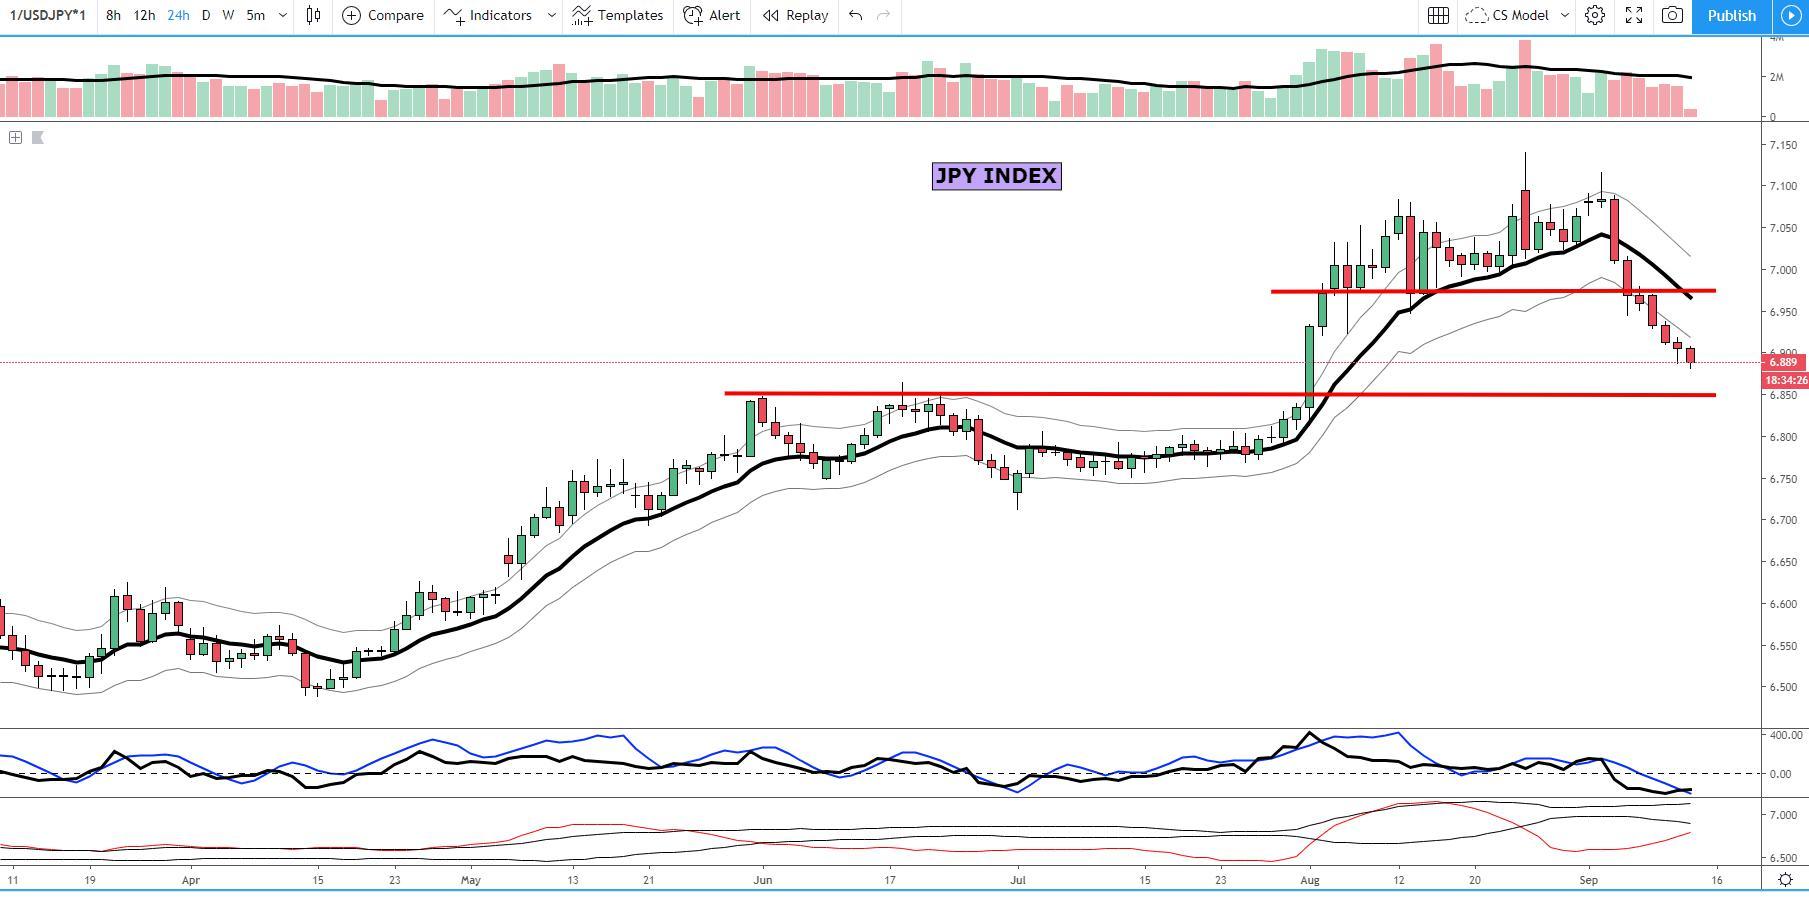
The JPY index is as bearish as it gets, with another 0.75% of losses projected until the currency finds stronger bids at a key level of support as per the double top in June this year. The index is on its way to accumulating 7 days of losses in a row in line with thriving risk appetite dynamics. When last week’s quadfecta of positive news were known, I mentioned the market was facing the risk of a major readjustment in the pricing of risk assets due to the macro implications it had, and so far, the one-way street movements is proving this protracted supply imbalance to prove a fairly good hint for those looking to deploy momentum-based strategies. But again, if you are after a good pricing to sell the yen in the higher timeframes, those levels are gone.
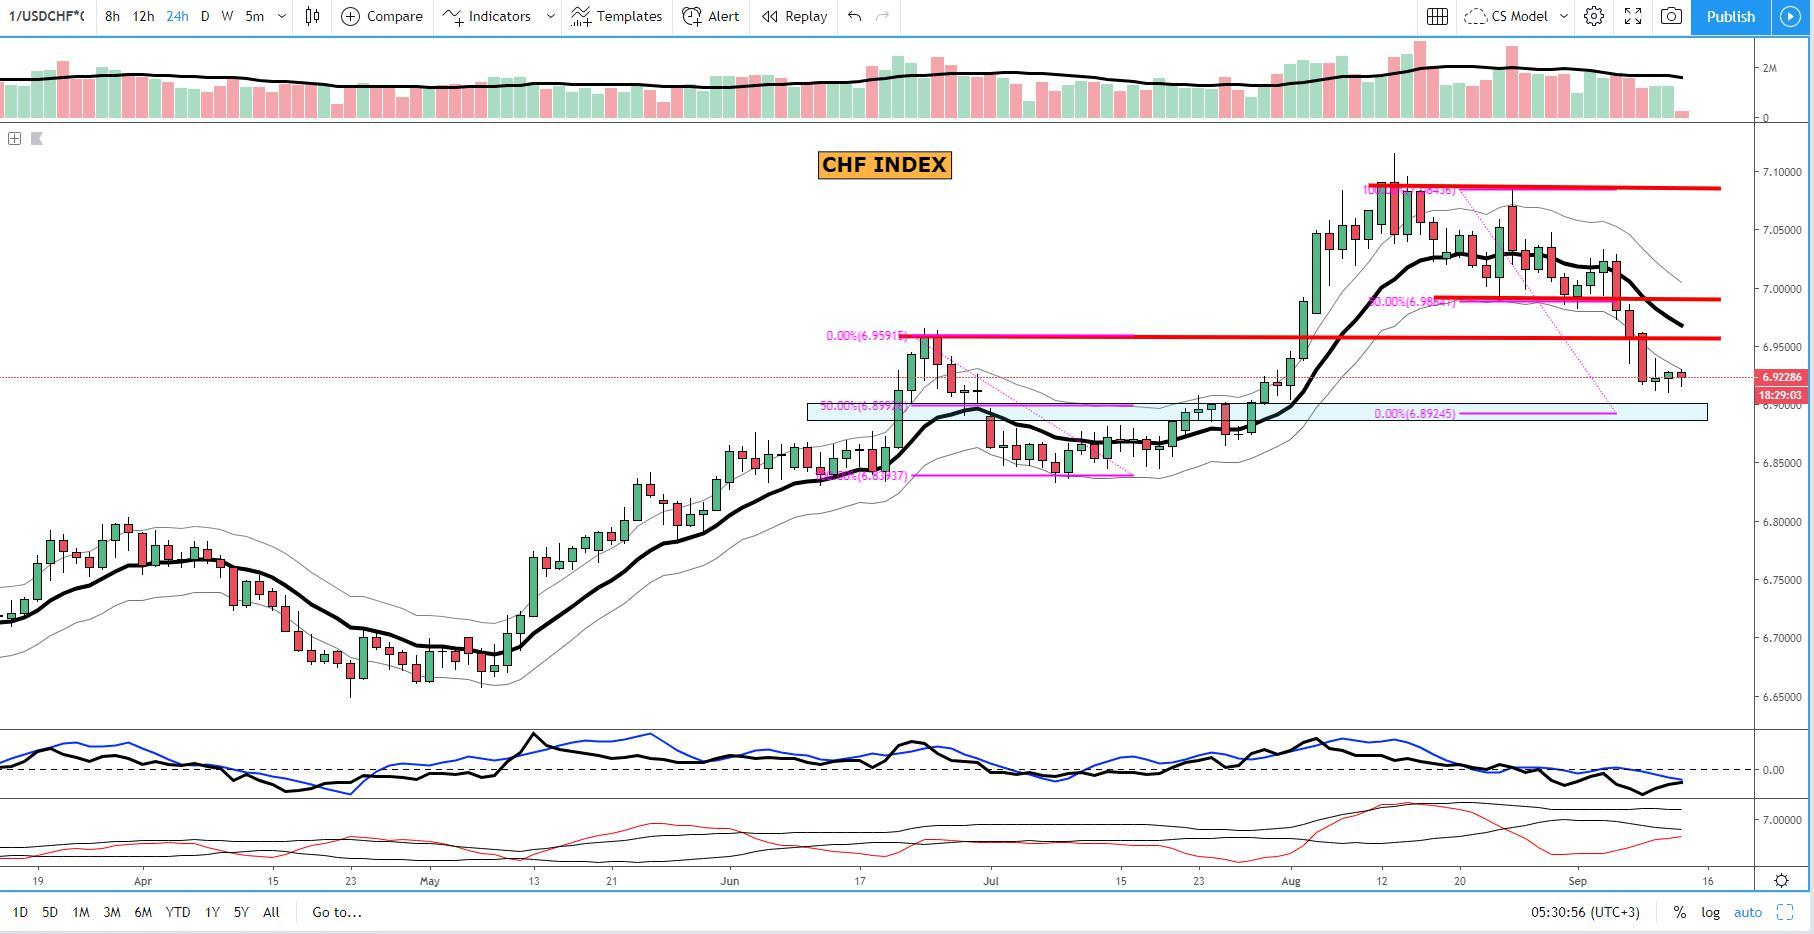
The CHF index shows no signs of reversing the negative technicals, with an additional 0.5% of losses in store until the 100% proj target is met, where I’d expect a stronger bidding pressure. Following 3 days of plummeting in its valuation, the Swissy has found a bit of a respite in the last two days, but the area is bouncing off is not technically significant yet. My outlook for the Swissy remains to sell strengths even if today’s performance will be much more dependable than usual to the fundamentals surrounding the EUR and the indirect impact of flows into the CHF.
Important Footnotes
- Risk model: The fact that financial markets have become so intertwined and dynamic makes it essential to stay constantly in tune with market conditions and adapt to new environments. This prop model will assist you to gauge the context that you are trading so that you can significantly reduce the downside risks. To understand the principles applied in the assessment of this model, refer to the tutorial How to Unpack Risk Sentiment Profiles
- Cycles: Markets evolve in cycles followed by a period of distribution and/or accumulation. To understand the principles applied in the assessment of cycles, refer to the tutorial How To Read Market Structures In Forex
- POC: It refers to the point of control. It represents the areas of most interest by trading volume and should act as walls of bids/offers that may result in price reversals. The volume profile analysis tracks trading activity over a specified time period at specified price levels. The study reveals the constant evolution of the market auction process. If you wish to find out more about the importance of the POC, refer to the tutorial How to Read Volume Profile Structures
- Tick Volume: Price updates activity provides great insights into the actual buy or sell-side commitment to be engaged into a specific directional movement. Studies validate that price updates (tick volume) are highly correlated to actual traded volume, with the correlation being very high, when looking at hourly data. If you wish to find out more about the importance tick volume, refer to the tutorial on Why Is Tick Volume Important To Monitor?
- Horizontal Support/Resistance: Unlike levels of dynamic support or resistance or more subjective measurements such as fibonacci retracements, pivot points, trendlines, or other forms of reactive areas, the horizontal lines of support and resistance are universal concepts used by the majority of market participants. It, therefore, makes the areas the most widely followed and relevant to monitor. The Ultimate Guide To Identify Areas Of High Interest In Any Market
- Trendlines: Besides the horizontal lines, trendlines are helpful as a visual representation of the trend. The trendlines are drawn respecting a series of rules that determine the validation of a new cycle being created. Therefore, these trendline drawn in the chart hinge to a certain interpretation of market structures.
- Correlations: Each forex pair has a series of highly correlated assets to assess valuations. This type of study is called inter-market analysis and it involves scoping out anomalies in the ever-evolving global interconnectivity between equities, bonds, currencies, and commodities. If you would like to understand more about this concept, refer to the tutorial How Divergence In Correlated Assets Can Help You Add An Edge.
- Fundamentals: It’s important to highlight that the daily market outlook provided in this report is subject to the impact of the fundamental news. Any unexpected news may cause the price to behave erratically in the short term.
- Projection Targets: The usefulness of the 100% projection resides in the symmetry and harmonic relationships of market cycles. By drawing a 100% projection, you can anticipate the area in the chart where some type of pause and potential reversals in price is likely to occur, due to 1. The side in control of the cycle takes profits 2. Counter-trend positions are added by contrarian players 3. These are price points where limit orders are set by market-makers. You can find out more by reading the tutorial on The Magical 100% Fibonacci Projection