Investing.com’s stocks of the week
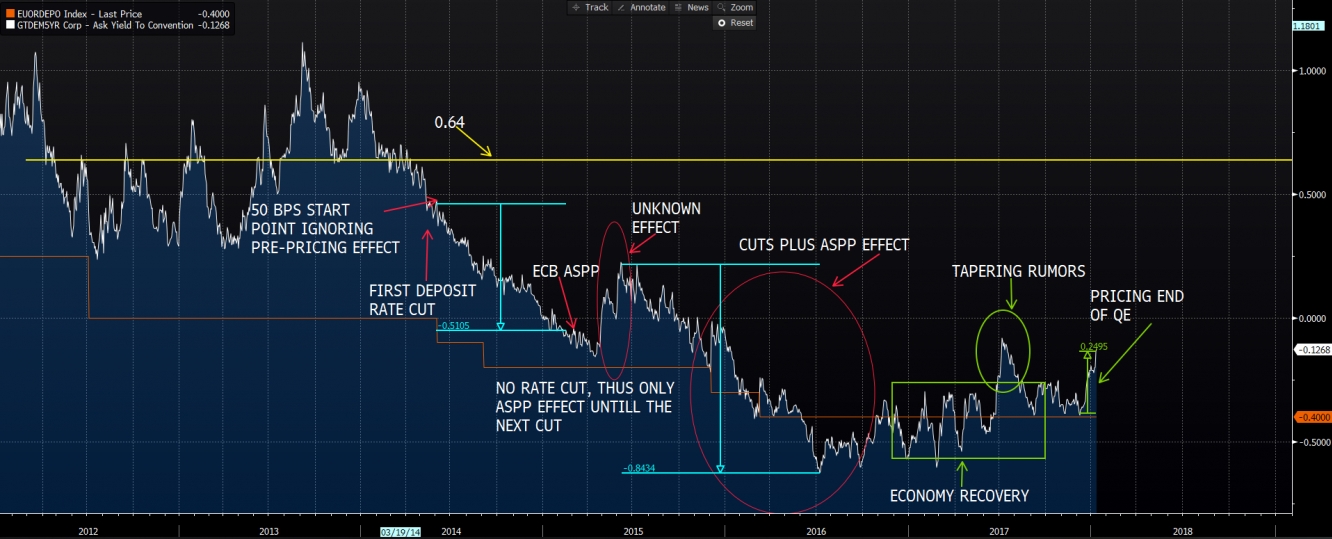
I asked myself what can be loss if I you have a EUR portfolio with 100,000 DV01 and duration of 5. Well, I start thinking I am obsessed with 5 year duration. However, for your information in this case, in some sense, it was a random selection. And this is what I ended up with. Let me first show you the chart.
Source: Chart is created using Bloomberg terminal
This is the chart with 5 year Germany treasury and ECB deposit facility rate. Once upon a time dark lord ECB decided to cut rates. It was tough decision, prince economy was sick and some actions should have been taken. All right, let’s get back to reality. First cut that drove deposit facility rate to negative territory took place in 2014. At that moment 5 year treasury was at 0.5% level. We saw 2 rate cuts during 2014 and the rate fell to 0% during 2014. In March 2015 ECB announces Asset Purchasing Program (ASPP), rate keeps falling until the mid-April and reverses until the mid-June. This period I called the period of unknown effect. Straight after that we see a long lasted decline that was caused by both ASPP and 2 more rate cuts in December 2015 and March 2016. This period is marked as “Cuts plus ASPP effect”. Later we witnessed recovery in the Eurozone, economy started over performing expectations, in the second half of 2017 we had some tapering rumors (marked green). And we have sell-off nowadays. All right, now when we almost have the full picture, we can do some calculations.
As I mentioned earlier rate was at 0.5% level before the first rate cut. In July 2016 it fell to around -0.6%. So what happened during that period? 4 rate cuts and ASPP. In the period between the first cut and announcement of Asset Purchasing Program rate fell around 50 bps (marked with blue line). So let’s say, ignoring pre-pricing factor, the effect of 2 rate cuts was 50 bps. Afterward we had “unknown effect”, that we ignore (I will come back to it later) and 80 bps decline that was caused by both rate cuts and ASPP (marked with blue line). If we say 50 bps decline comes from 2 rate hikes, than the left portion belongs to the ASPP which is 30 bps. If we summarize information provided above we have 30 bps that comes from ASPP and 25 bps that comes from a rate cut.
Yield was at 0.5% and fell to -0.6%, thus 1.1% decrease. We can expect the same to be reversed, however I think that would be wrong. Market started pricing end of QE when rate was at -0.4% level in December 2017. Since then it went up by almost 25 bps. So end of ASPP that caused 30 bps decline is almost priced. One more interesting point to mention, if yield goes up by 5 more bps it will reach the high of 2017 and the same level might be strong resistance again. What will be left for this year after fully pricing end of QE is to price one rate hike for 2019. And then the actual rate hikes with one being pre-priced. So the reverse of the trend we had in 2014, 2015, 2016 started at around -0.4% level. It might go up by 30 bps due to ASPP and 1% due to rate hikes. -0.4%+0.3+1%= 0.9%. I mentioned earlier that I have period called “unknown period” that I ignored in the first part of my calculations. Therefore based on so-called “history repeats itself” I ignore that also in the second part of my calculations. So if I deduct 25 bps from 0.9% I end up with 0.65%. It should be noted that this level is very close to the strong support/resistance level of 2012 and 2013.

