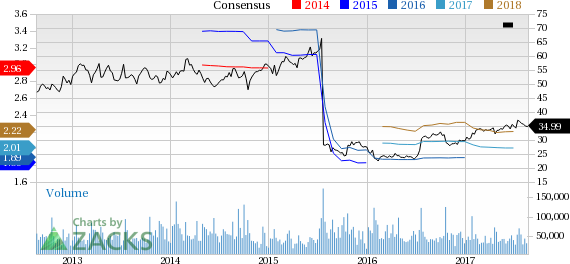
It has been about a month since the last earnings report for eBay Inc. (NASDAQ:EBAY) . Shares have lost about 6.3% in that time frame, underperforming the market.
Will the recent negative trend continue leading up to the stock's next earnings release, or is it due for a breakout? Before we dive into how investors and analysts have reacted of late, let's take a quick look at the most recent earnings report in order to get a better handle on the important catalysts.
eBay Q2 Earnings Miss Estimates, Revenues Beat
eBay's second-quarter 2017 earnings of $0.34 per share missed the Zacks Consensus Estimate by 2 cents.
Revenues of $2.33 billion, however, beat the Zacks Consensus Estimate by a slight margin and came ahead of the guided range.
Revenues
Gross revenues of $2.3 billion were up 4.4% on a y/y basis (up 7% on an Fx-neutral basis). In the second quarter, the Marketplace platform contributed $20.5 billion of gross merchandise volume (GMV) and $1.9 billion of revenues. Marketplace GMV grew 3% year over year on a reported basis and 6% on an FX-Neutral basis. StubHub also showed signs of accelerated growth with contribution of $1 billion of GMV, down 5% on a y/y basis, and revenues of $236 million, up 5% year over year.
Classifieds platforms also performed well with contribution of $219 million of revenues, up 6% year over year on a reported basis and 11% on an FX-Neutral basis.
Gross merchandise volume grew 3% year over year on a reported basis and 5% on an Fx-neutral basis to $21.5. Active buyers/customers increased 4% from the year-ago quarter.
Margins and Income
Pro-forma gross margin for the quarter was 76.2%, down 191 basis points (bps) year over year and 93 bps sequentially.
Cost of revenues increased 13.8% on a y/y basis primarily due to expenses associated with TicketbiS operations, incremental investments in customer support and the expansion of first-party inventory program in Korea.
Adjusted operating expenses of $1.3 billion increased 5.9% from the prior-year quarter and 11.9% sequentially. Operating margin shrank 267 bps year over year and 430 bps sequentially to 21%.
GAAP net income was $27 million ($0.02 per share) compared with $437 million ($0.38 per share) in the year-ago quarter.
Balance Sheet and Cash Flow
eBay’s balance sheet is highly leveraged, with total debt of $11.5 billion eclipsing cash and short-term investments balance of $9 billion. The company generated $699 million in cash from operating activities and spent $182 million on capex. Share repurchases were $507 million in the quarter.
Outlook
For the third quarter of 2017, eBay expects revenues to grow 6%–8% on an Fx-neutral basis to $2.35 billion – $2.39 billion. Non-GAAP earnings are expected within $0.46–$0.48. GAAP earnings per share from continuing operations are expected in the range of $0.30 - $0.32.
In 2017, eBay expects revenues to grow 6 on an Fx-neutral basis to $9.3 billion – $9.5 billion.
How Have Estimates Been Moving Since Then?
Analysts were quiet during the last one month period as none of them issued any earnings estimate revisions.
eBay Inc. Price and Consensus
VGM Scores
At this time, eBay's stock has a poor Growth Score of F, a grade with the same score on the momentum front. The stock was allocated a grade of D on the value side, putting it in the bottom 40% for this investment strategy.
Overall, the stock has an aggregate VGM Score of F. If you aren't focused on one strategy, this score is the one you should be interested in.
Our style scores indicate investors will probably be better served looking elsewhere.
Outlook
The stock has a Zacks Rank #3 (Hold). We expect in-line returns from the stock in the next few months.
eBay Inc. (EBAY): Free Stock Analysis Report
Original post
Zacks Investment Research

