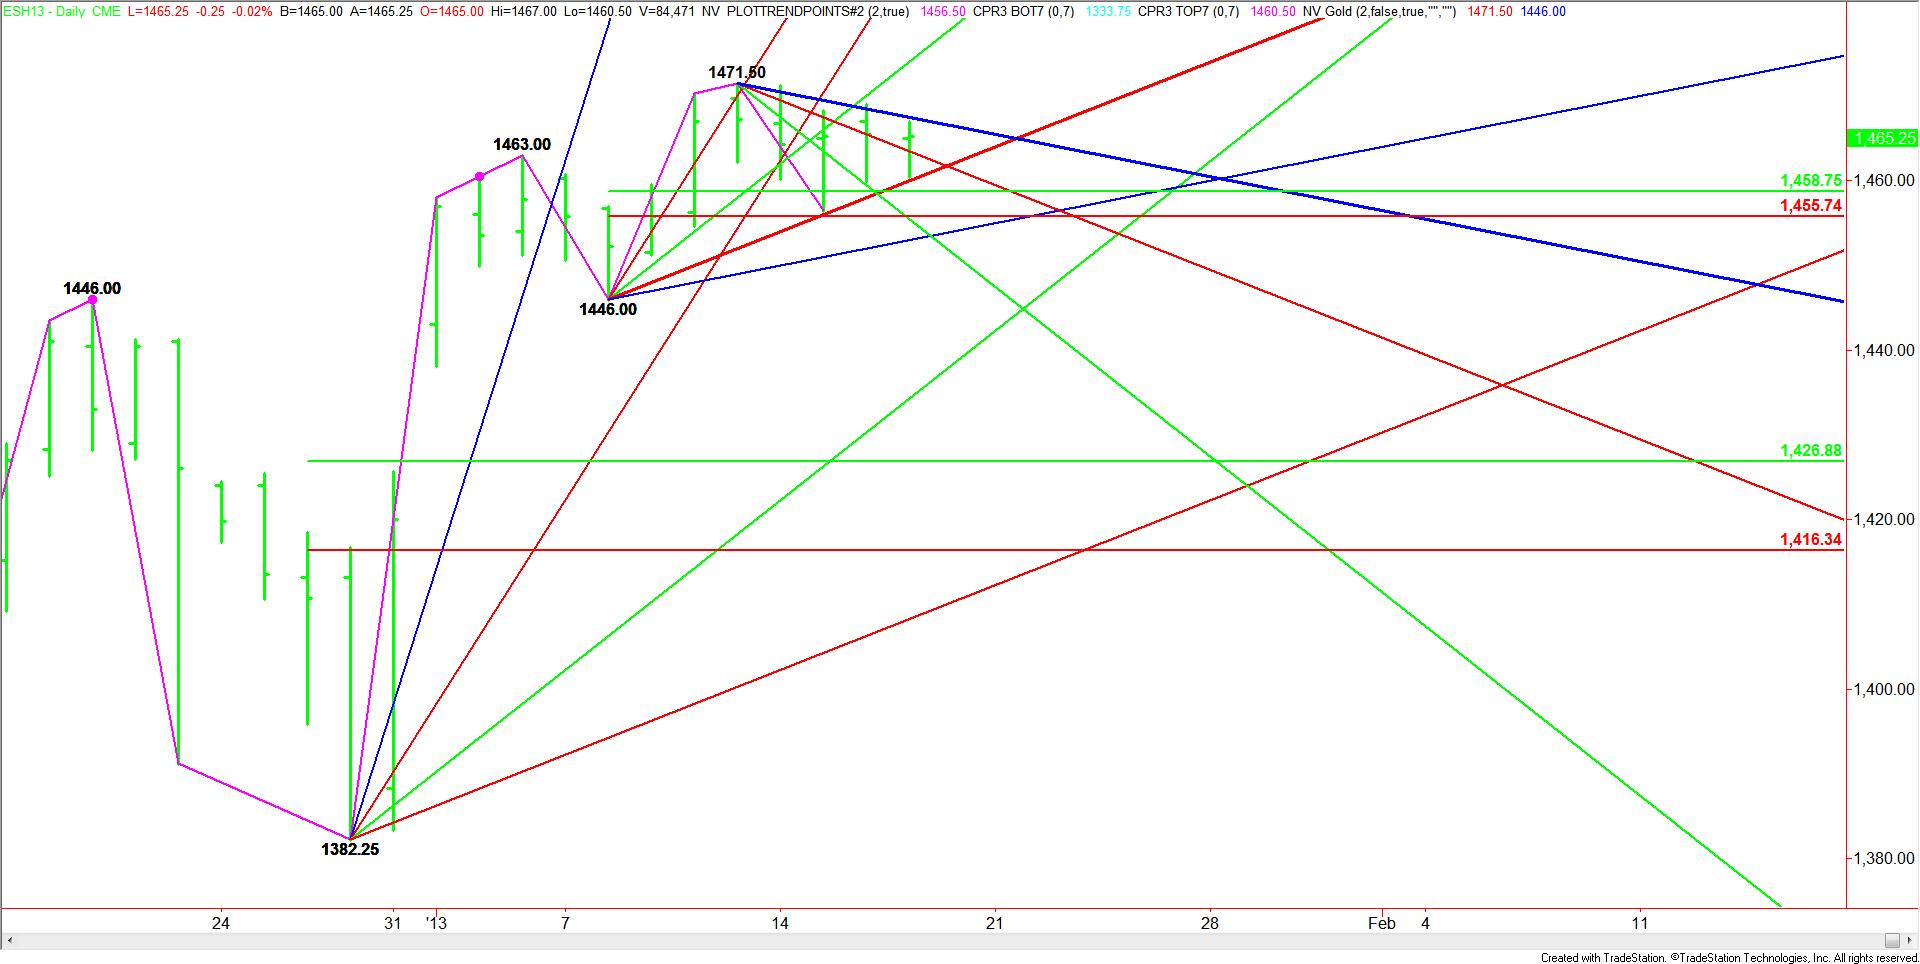
The March E-mini S&P 500 futures contract is currently sitting inside of a triangle chart pattern bounded by Gann angle resistance at 1467.50 and Gann angle support at 1460.00. The triangle chart pattern is considered by many technical analysts to be a non-trending pattern that indicates impending volatility. The pattern doesn’t predict the direction but does give a trader as to where the market is likely to breakout.
It may the upcoming opinion expiration, or the uncertainty over the debt ceiling debate, but investors have been keeping their distance from the market since they put a near record amount of funds into equities during the first week of the year. The compression of the daily price ranges suggest that something is about to happen to trigger a volatile move.

A breakout through 1467.50 is likely to trigger a quick move to the recent top at 1471.50. Beyond this price level is a guess since it is basically uncharted territory.
If investors decide the downside is the way of least resistance, then look for a choppy trade following the first test of a short-term retracement zone at 1458.75 to 1455.75. Once this zone is cleared then the index will take a run at a slow-moving Gann angle at 1.453.00. A failure to hold this level is likely to attract fresh selling pressure that should take the market into a main bottom at 1446.00.
The main trend is still up, but a break through 1446.00 will turn it down. This would be more evidence pointing to an eventual retracement of the 1382.25 to 1471.50 range to 1426.75 to 1416.25.
It may the upcoming opinion expiration, or the uncertainty over the debt ceiling debate, but investors have been keeping their distance from the market since they put a near record amount of funds into equities during the first week of the year. The compression of the daily price ranges suggest that something is about to happen to trigger a volatile move.

A breakout through 1467.50 is likely to trigger a quick move to the recent top at 1471.50. Beyond this price level is a guess since it is basically uncharted territory.
If investors decide the downside is the way of least resistance, then look for a choppy trade following the first test of a short-term retracement zone at 1458.75 to 1455.75. Once this zone is cleared then the index will take a run at a slow-moving Gann angle at 1.453.00. A failure to hold this level is likely to attract fresh selling pressure that should take the market into a main bottom at 1446.00.
The main trend is still up, but a break through 1446.00 will turn it down. This would be more evidence pointing to an eventual retracement of the 1382.25 to 1471.50 range to 1426.75 to 1416.25.
