E*TRADE Financial Corporation (ETFC) is a financial services company, which provides online brokerage and related products and services to the individual retail investors, under the brand E*TRADE Financial.
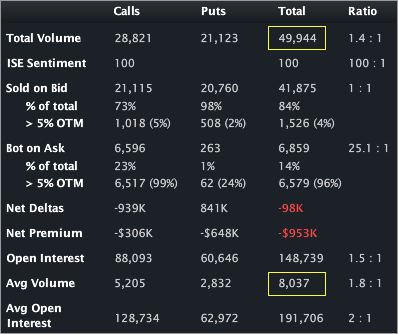
This is a vol note tied to some very interesting order flow. Let’s start with the flow. ETFC has traded nearly 50,000 contracts in the first hour and a half on total daily average volume of just 8,037. The largest trade has been a sale of 19,200 Mar 9 straddles @ $0.80 (so, 38,400 contracts). The Livevol® Stats and Day’s Biggest Trades snaps are included below.

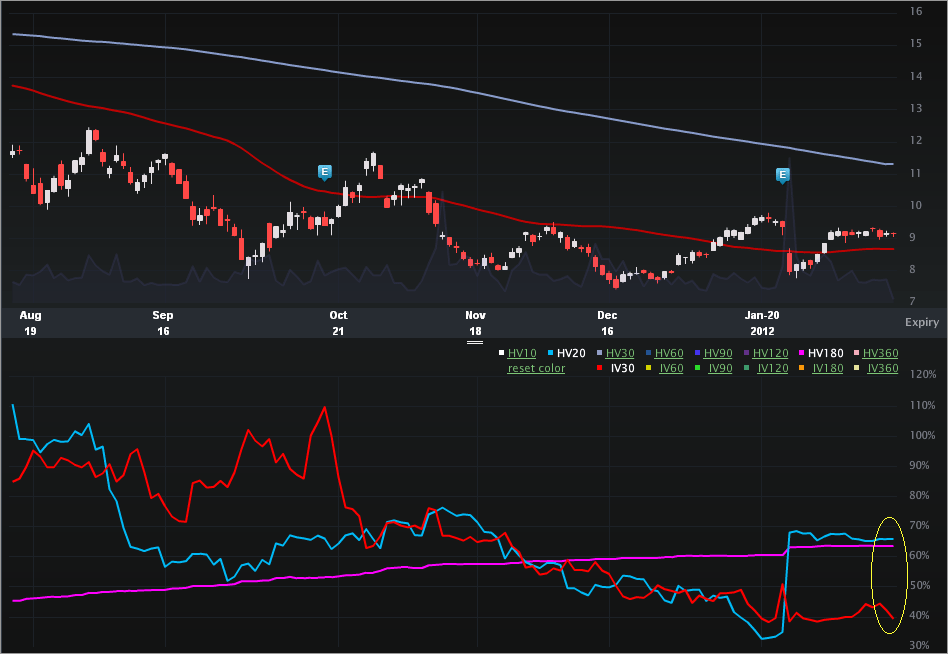
That order flow has helped push the vol down today. The interesting part of the vol sale is the level that was sold. Let’s turn to the Charts Tab (six months), below. The top portion is the stock price, the bottom is the vol (IV30™ - red vs HV20™- blue vs HV180™- pink).
Check out the vol portion. We can see that the implied is trading at (or near) six month lows and substantially below the historical measures. One point to note, the HV20™ is artificially elevated because of the stock gap off of earnings a couple of weeks ago. Still, the 52 wk range in IV30™ is [24.15%, 109.60%], so the current level is in the 18th percentile (annual). That means the sale was of particularly depressed vol and bets on even lower vol in the future. Very interesting.
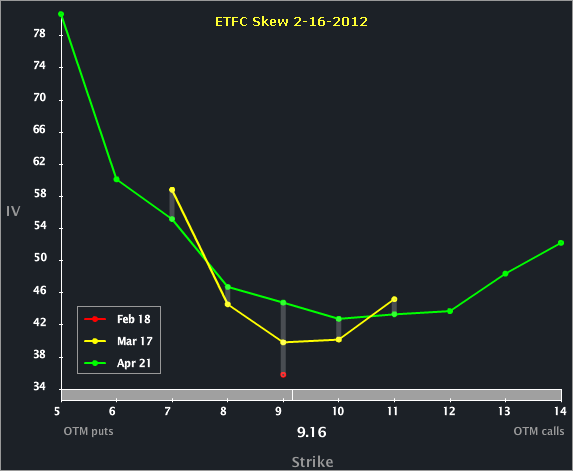
Let’s turn to the Skew Tab.
We can see the vol drops from the back to the front monotonically. Or, said differently, the vol is higher further out. The Mar vol that was sold is considerably lower than the Apr expiry.
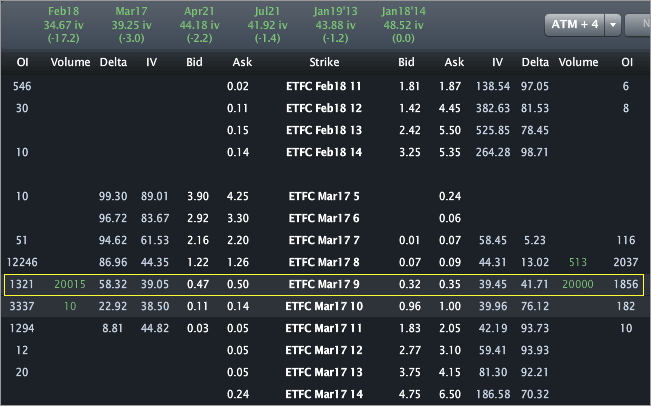
Let’s turn to the Options Tab.
I wrote about this one for TheStreet (OptionsProfits), so no specific trade analysis here. But, I can say that I’ve highlighted the line that was sold. It looks like ~39% vol. We can also see that Apr is priced to 44.18%. The vol sale is simply a bet that the depressed vol is "correct" and that it will move even lower.
This is trade analysis, not a recommendation.
- English (UK)
- English (India)
- English (Canada)
- English (Australia)
- English (South Africa)
- English (Philippines)
- English (Nigeria)
- Deutsch
- Español (España)
- Español (México)
- Français
- Italiano
- Nederlands
- Português (Portugal)
- Polski
- Português (Brasil)
- Русский
- Türkçe
- العربية
- Ελληνικά
- Svenska
- Suomi
- עברית
- 日本語
- 한국어
- 简体中文
- 繁體中文
- Bahasa Indonesia
- Bahasa Melayu
- ไทย
- Tiếng Việt
- हिंदी
E*TRADE Financial: Vol Seller Pounds Depressed Vol
Published 02/17/2012, 01:06 AM
Updated 07/09/2023, 06:31 AM
E*TRADE Financial: Vol Seller Pounds Depressed Vol
Latest comments
Loading next article…
Install Our App
Risk Disclosure: Trading in financial instruments and/or cryptocurrencies involves high risks including the risk of losing some, or all, of your investment amount, and may not be suitable for all investors. Prices of cryptocurrencies are extremely volatile and may be affected by external factors such as financial, regulatory or political events. Trading on margin increases the financial risks.
Before deciding to trade in financial instrument or cryptocurrencies you should be fully informed of the risks and costs associated with trading the financial markets, carefully consider your investment objectives, level of experience, and risk appetite, and seek professional advice where needed.
Fusion Media would like to remind you that the data contained in this website is not necessarily real-time nor accurate. The data and prices on the website are not necessarily provided by any market or exchange, but may be provided by market makers, and so prices may not be accurate and may differ from the actual price at any given market, meaning prices are indicative and not appropriate for trading purposes. Fusion Media and any provider of the data contained in this website will not accept liability for any loss or damage as a result of your trading, or your reliance on the information contained within this website.
It is prohibited to use, store, reproduce, display, modify, transmit or distribute the data contained in this website without the explicit prior written permission of Fusion Media and/or the data provider. All intellectual property rights are reserved by the providers and/or the exchange providing the data contained in this website.
Fusion Media may be compensated by the advertisers that appear on the website, based on your interaction with the advertisements or advertisers.
© 2007-2025 - Fusion Media Limited. All Rights Reserved.
