
Backed by growth in revenues and occupancy gains, Prologis, Inc. (NYSE:PLD) came up with third-quarter 2016 core funds from operations (“FFO”) per share of 73 cents, beating the Zacks Consensus Estimate of 70 cents. It also improved from the year-ago quarter figure of 58 cents.
Better-than-expected growth in revenues, backed by improved operating performance and higher net promote income, was primarily responsible for this beat.
Further, this industrial real estate investment trust (REIT) raised its core FFO per share outlook for the full year amid better-than-expected market fundamentals and solid results in the third quarter.
Share of Prologis gained 0.6% in the beginning of the trading session today, reflecting investors’ positive sentiments. However, the price reaction during the full trading session will give a better idea.
The company posted revenues of $704.6 million, which beat the Zacks Consensus Estimate of $604.3 million. It compared favorably with the year-ago number of $580.6 million.
Amid a consistent shift toward e-commerce and supply chain strategy transformations, Prologis’ occupancy and leasing volumes remained high. In fact, the company witnessed broad-based demand across customer segments, driven by e-commerce, automotive, consumer products and construction supplies. Also, Prologis focused consistently on bolstering its liquidity, which is encouraging.
Higher Leasing Volume & Occupancy
At the end of the third quarter, occupancy level in the company’s operating portfolio was 96.6%, expanding 60 basis points year over year.
During third-quarter 2016, Prologis signed 46 million square feet of leases in its owned and managed portfolio, compared with 42 million square feet in the year-ago period.
Prologis' share of net effective rent change was 15.0% in the reported quarter, compared with 12.0% a year ago, reflecting 23.3% growth in the U.S. portfolio and a 20.5% increase in the U.K. portfolio. Cash rent change was 5.7% against 3.6% in the year-ago quarter.
Its share of net effective same-store net operating income (NOI) registered 5.6% growth, compared with the 6.2% increase reported in the prior-year period, driven by 6.9% growth in the U.S. Cash Same Store NOI climbed 6.6% against 4.5% in the year-ago period.
Dispositions and Development Starts On Track
In third-quarter 2016, Prologis' share of building acquisitions amounted to $17 million, development stabilization aggregated $392 million, while development starts totaled $434 million. Further, its total dispositions and contributions were $517 million.
Liquidity Profile Strengthened
Prologis ended the quarter with $3.8 billion of liquidity. Further, during the reported quarter, the company and its co-investment ventures accomplished $1.3 billion of financings, including a ¥120 billion loan. Finally, the company exited third-quarter 2016 with cash and cash equivalents of $375.1 million, up from $332.2 million at the end of the prior year.
Outlook Raised
Prologis raised core FFO per share outlook for 2016. The company now projects core FFO per share in the range of $2.56–$2.57, up from $2.52–$2.58 guided earlier.
Further, according to the company, net effective same store net operating income (NOI) – Prologis share – is expected to grow at 5.50–5.80% compared to the previous outlook of 4.75% – 5.25%.
Our Take
We are encouraged with Prologis’ Q3 FFO beat. With companies opting for supply chain consolidation amid an e-commerce boom, heightened urbanization and a wider customer base, demand for logistics infrastructure and efficient distribution networks has been increasing, providing huge growth opportunities. Yet, earnings dilutive effects of dispositions, supply increase and interest rate issues are concerns for Prologis.
PROLOGIS INC Price, Consensus and EPS Surprise
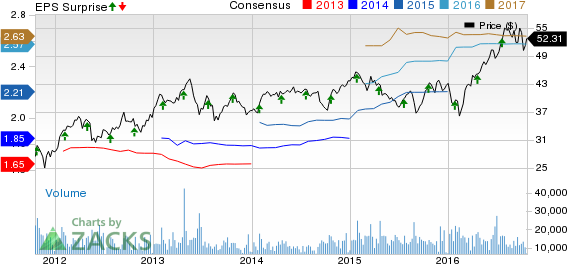
PROLOGIS INC Price, Consensus and EPS Surprise | PROLOGIS INC Quote
Prologis currently carries a Zacks Rank #3 (Hold). You can see the complete list of today’s Zacks #1 Rank (Strong Buy) stocks here.
We now look forward to the earnings releases of the other REITs like Avalonbay Communities Inc. (NYSE:AVB) , Boston Properties Inc. (NYSE:BXP) and Equity Residential (NYSE:EQR) . Avalonbay is slated to come up with its earnings release on Oct 24 while Boston Properties and Equity Residential have their earnings releases scheduled on Oct 25.
Note: All EPS numbers presented in this write up represent funds from operations (“FFO”) per share. FFO, a widely used metric to gauge the performance of REITs, is obtained after adding depreciation and amortization and other non-cash expenses to net income.
Confidential from Zacks
Beyond this Analyst Blog, would you like to see Zacks' best recommendations that are not available to the public? Our Executive VP, Steve Reitmeister, knows when key trades are about to be triggered and which of our experts has the hottest hand. Click to see them now>>
AVALONBAY CMMTY (AVB): Free Stock Analysis Report
EQUITY RESIDENT (EQR): Free Stock Analysis Report
PROLOGIS INC (PLD): Free Stock Analysis Report
BOSTON PPTYS (BXP): Free Stock Analysis Report
Original post
Zacks Investment Research