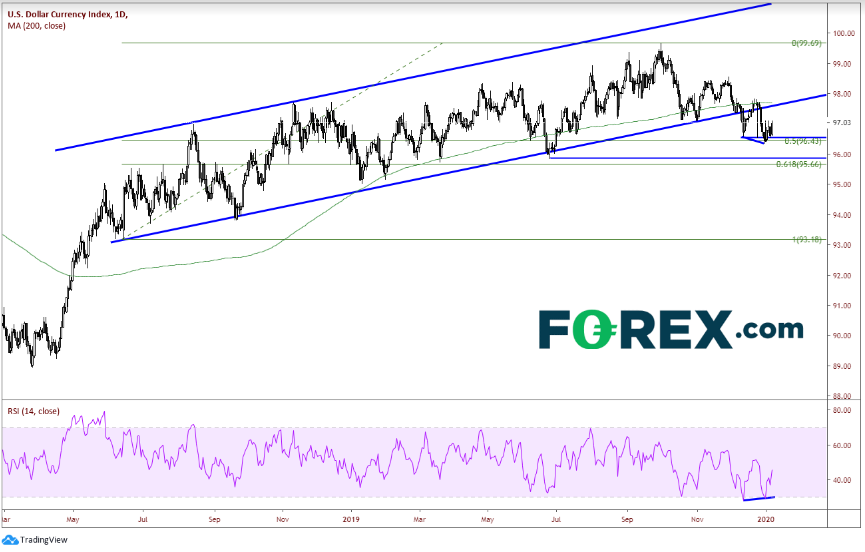
The US Dollar Index (DXY) has been in an upward sloping channel since early May of last year. Price hit a high of 99.67 on October 1st, 2019 and has pulled back to current levels near 97.00. There are several important technical indicators to take note of at the current point of the move lower:
1) During the pullback, DXY broke through the 200 Day Moving Average, which today come across at 97.69
2) Price broke below the lower rising trendline of the upward sloping trendline
3) DXY has attempted several times to break below the 50% retracement level from the beginning of the channel low at 93.19 to the October 1st high at 99.67. This level is 96.43.
4) On a daily timeframe, towards the end of 2019 the DXY and the RSI began to diverge as the RSI put in higher lows as price put in lower lows. This indicates a possible reversal in price may be ahead.

Source: Tradingview, FOREX.com
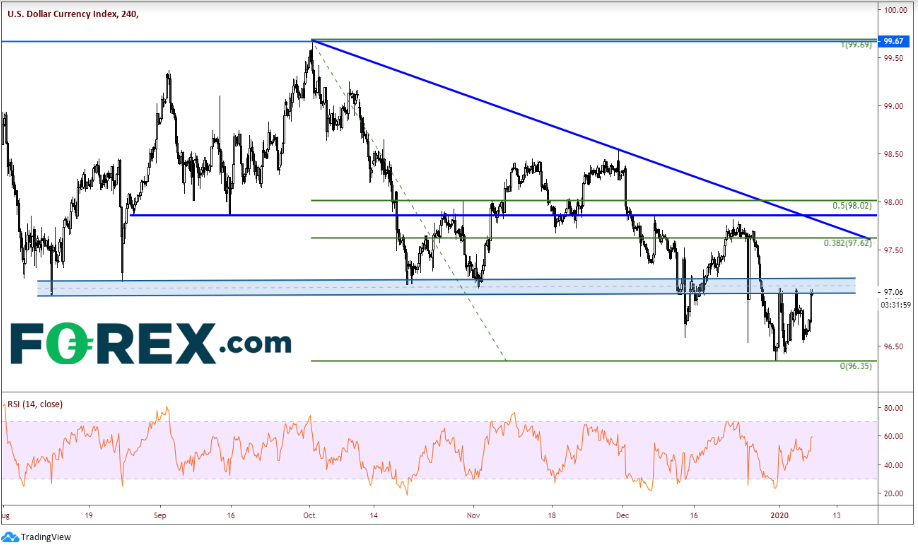
Today, DXY got the bounce, up almost +0.5%. However, one must consider how much higher price can go before pulling back. On a 240-minute chart, the DXY is currently near a triple top and fighting a band of resistance between 97.00 and 97.20. In addition, there is a large amount of resistance between 97.50 and 98.00 that the DXY must get through, and it doesn’t seem like its going to be easy! There is horizontal resistance at 97.60, as well as a downward sloping trendline of the October 1 highs which comes across near the same level. In addition, there is the 38.2 Fibonacci retracement level and the 50% retracement level from the October 1 high to the December 31 lows.

Source: Tradingview, FOREX.com
And keep in mind about the resistance from the daily chart, including a retest of the upward sloping trendline from the long-term channel and the 200 Day Moving average.
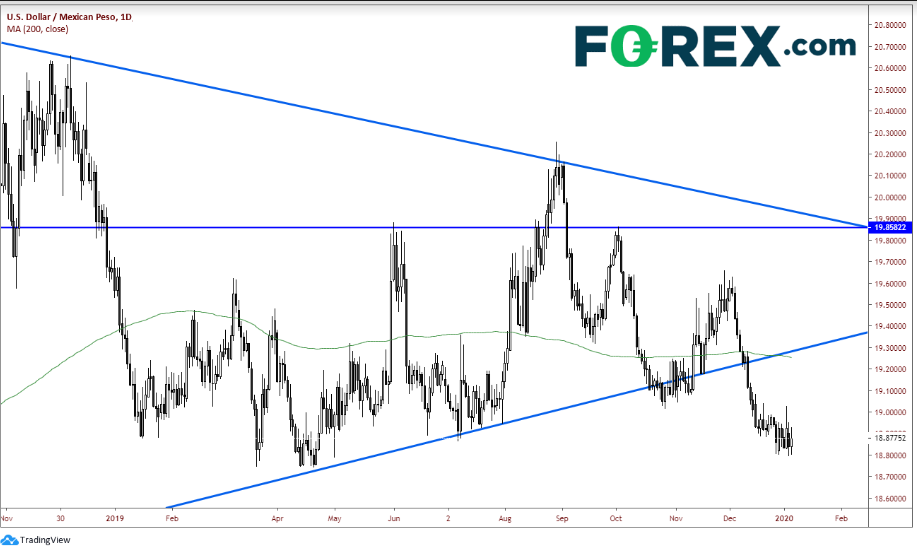
In addition, notice that recently USD/CAD and USD/MXN have broken down from their long-term triangles (which I have been writing about for the past few months) and are now consolidating below the upward sloping trendlines. Price in these two US Dollar pairs would also have to move back into their long-term triangles, which would pull DXY higher with them.

If the U.S. dollar Index is going to make a significant move higher, its going to have a lot of work to do!
