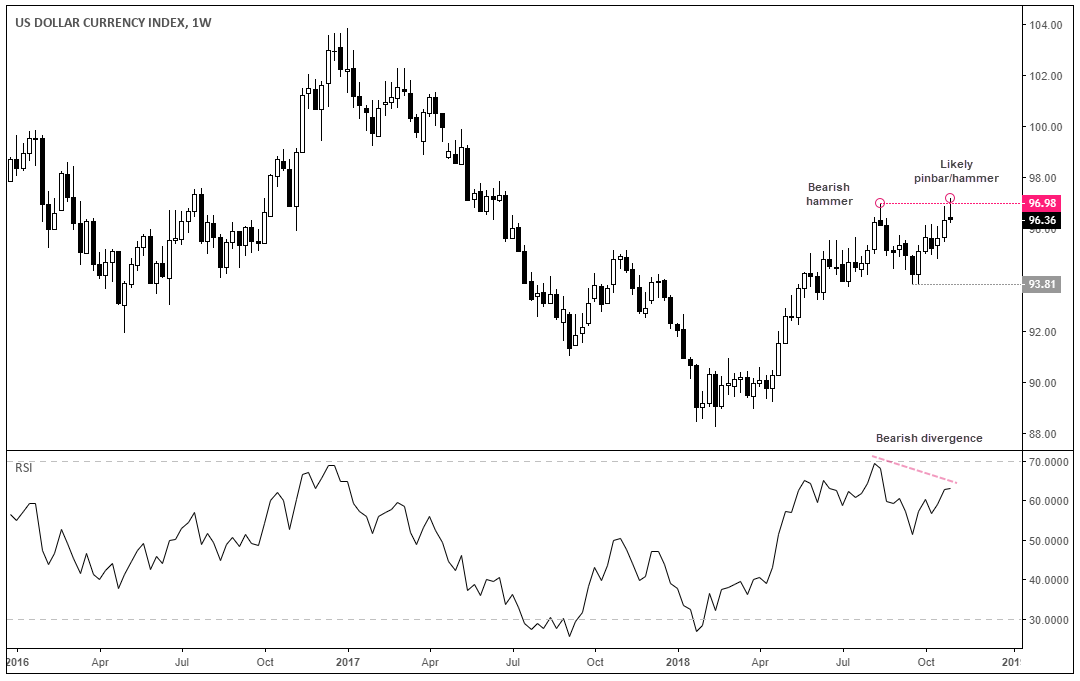
Around current levels, DXY is on track to close the week with a bearish reversal at the highs.

Its failure to hold above 96.98 resistance has the hallmarks of a bull-trap. Yet what makes it more intriguing is that it almost mirrors the hammer seen in August which marked a 3.6% decline spanning 6 weeks. Throw in the bearish RSI divergence and we have a case for a correction from current levels. Keep in mind that the weekly trend remains bullish above 93.81, but the odds appear to favour a pause in trend at the very least.
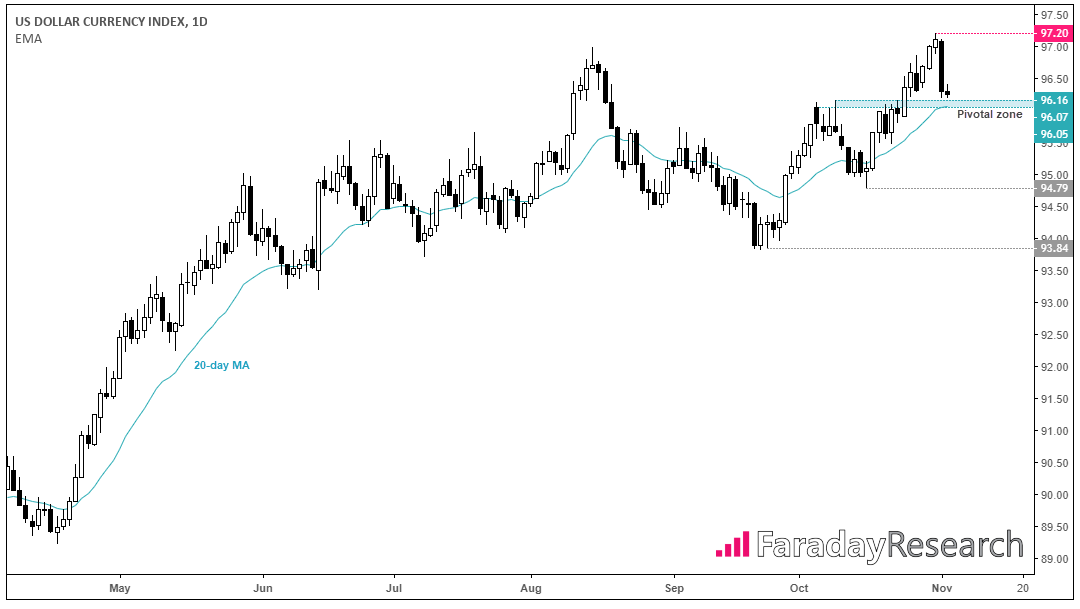
Switching to the daily chart clearly shows the magnitude of yesterday’s sell-off. Suffering its third most bearish session this year and largest sell-off during this year’s rally, bearish range expansion has clearly kicked in.

It’s also interesting to note that, over the past year, DXY has shown a tendency to close lower the following week after a large down day. With yesterday’s -0.88% decline being in the top-20 of bad days, we looked at how it performed against the other 19 occasions. Whilst DXY closed higher 55.6% of the time the following day, it closed lower 63.2% of occasions one week later. If it’s to follow that tendency, we could be in for a bounce before further losses, and price action on the daily could back this up.
As we head towards today’s NFP report, price action is within proximity to the 96.07/16 support zone which comprises of structural highs and the 20-day MA. It’s likely to tempt profit taking ahead of the weekend so, unless NFP is a disaster, it could close above this key zone. Yet if bears are to drive it lower next week, there’s not much in the way of support until 94.79. This could have huge implications for FX markets, although it’s worth pointing out that AUD/USD, NZD/USD and GBP/USD have all made solid progress from arguably oversold conditions.
