Investing.com’s stocks of the week
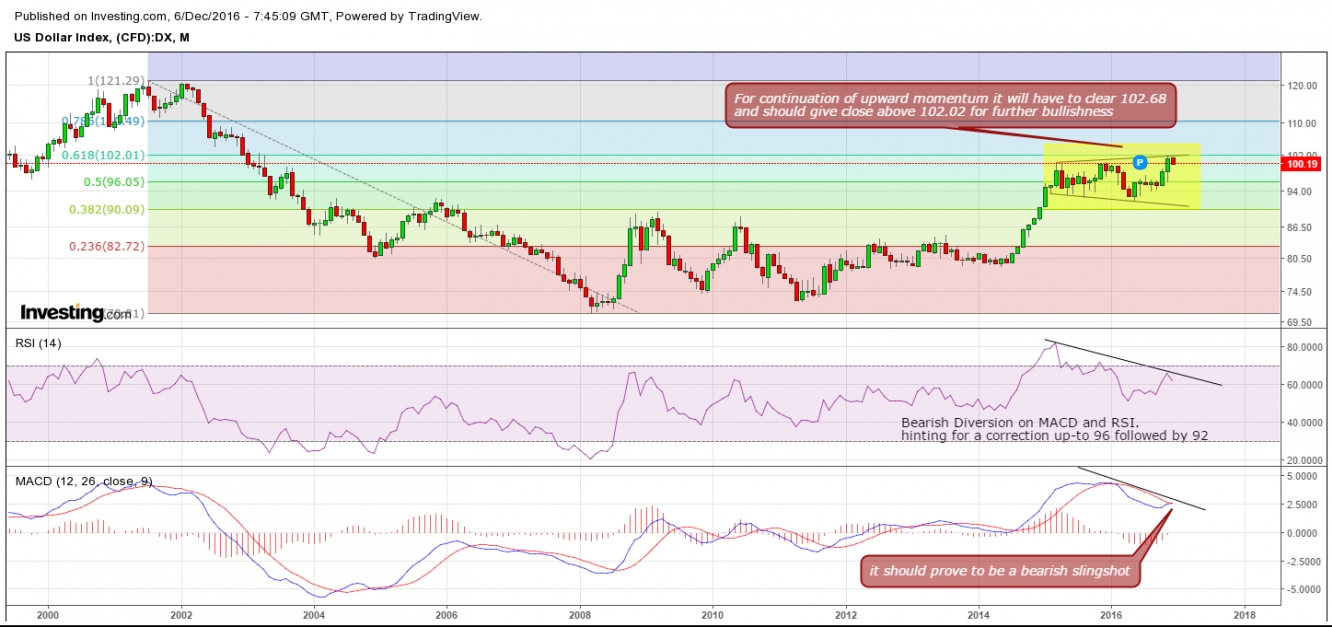
Here is the monthly chart of DX. It retraced the 61.8% of the previous fall from 121.37 (from the month of July 2001) to 70.81 (March 2008) and closed November at 101.54 after printing a high of 102.12 (just below 102.01 the 61.8% retracement). Meanwhile, it created a bearish diversion on its monthly chart and started to roll down. Possible bearish slingshot formation is taking place at MACD (let the market prove what it is going to be). RSI is starting to roll down.
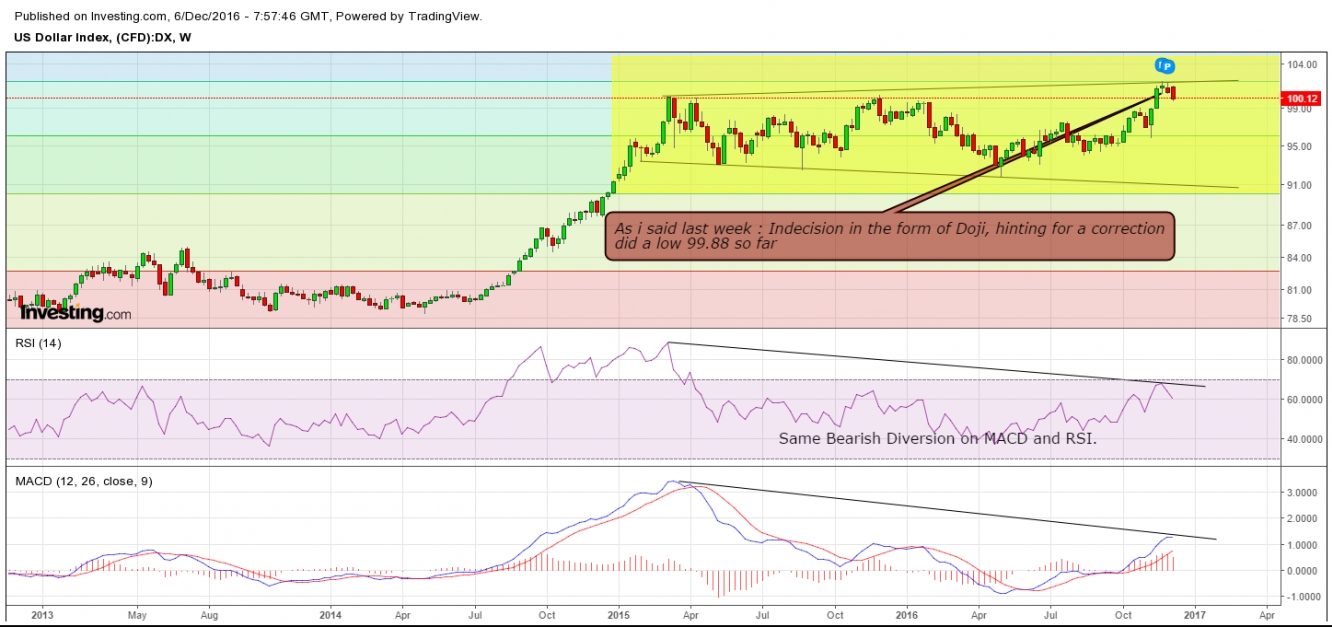
Here is the weekly chart, looks like very much similar to monthly chart except MACD, which is right now indicating a buy signal
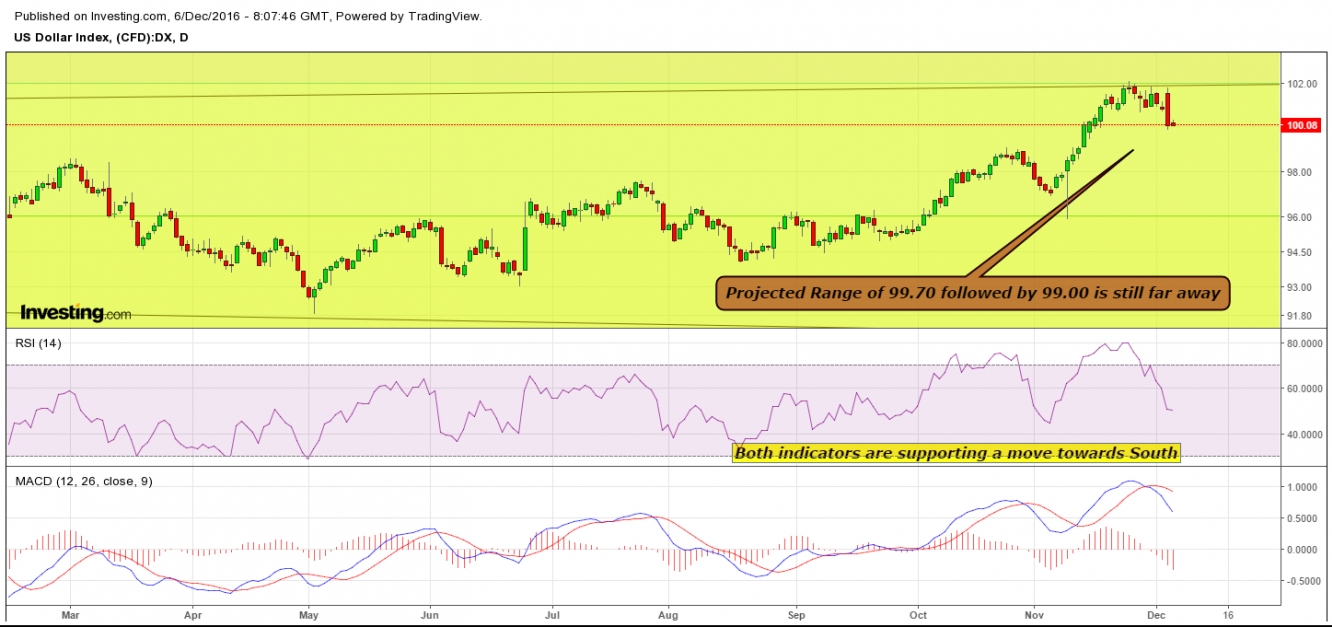
Lets move towards the daily chart. Yesterday morning I wrote about the expecation of a bearish move till 99.70 followed by 99.00. It partially happened, so far as the expected range is still far away from the site, printing the low at only 99.88 so far. Now, the previous support of 100.60-100.70 should act as solid resistance.
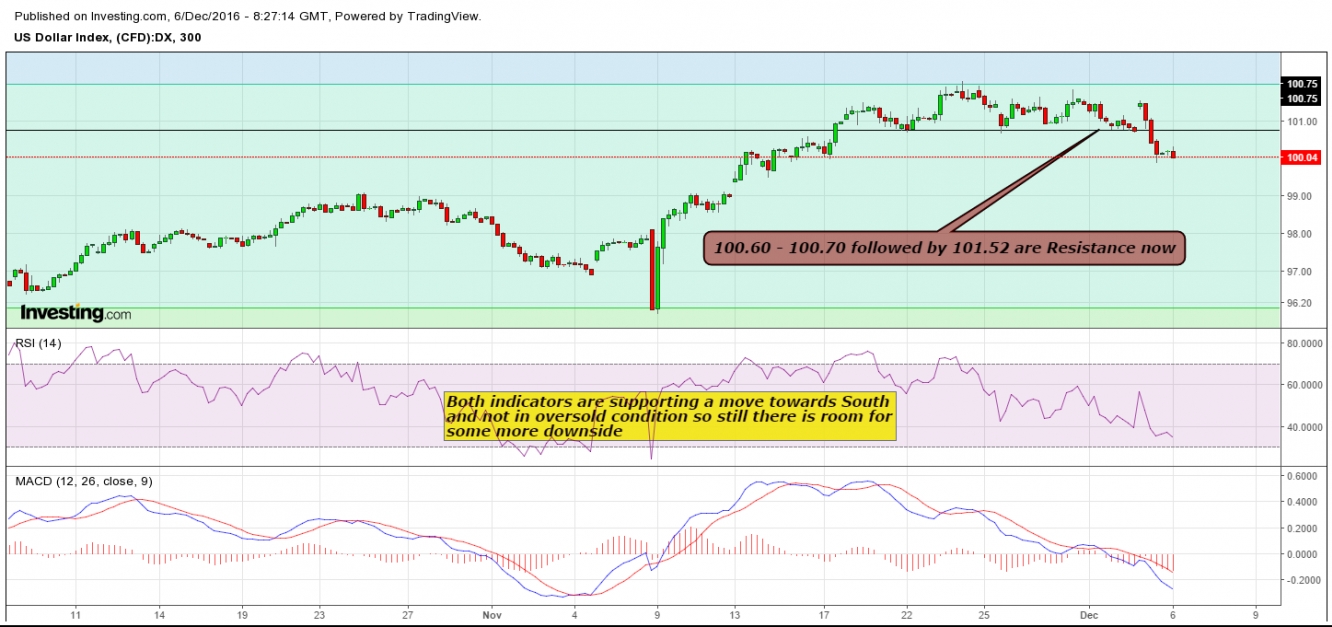
Here is the 5 hour chart. Both indicators are suggesting some more downside before a bounce to the upside, as these are still not in overslold territory. We are in a bearish camp.
Resistance: 100.70/101.52
Support: 99.68/99.00
A bearish DX most often (not always) favours the bullion complex, so it's the right time to buy gold/silver again for investment. Personally, I feel that there is good risk reward ratio from a trading perspective, too.


