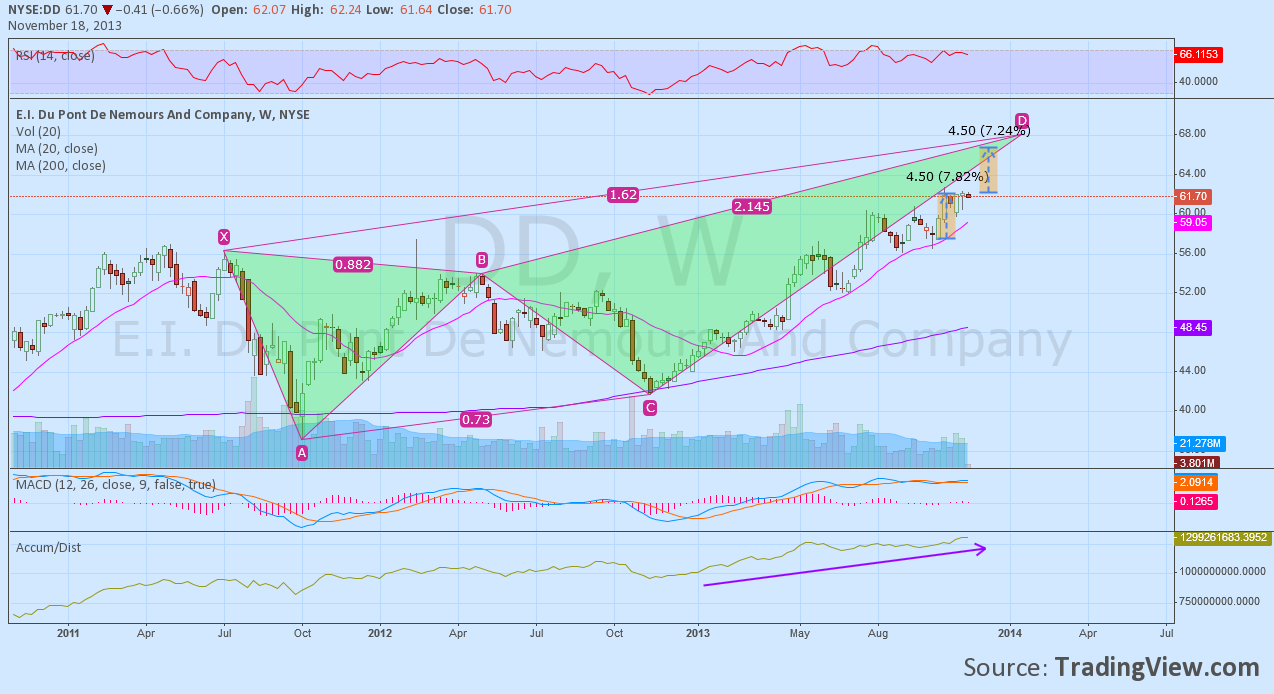
Whether you refer to the company as E.I. Du Pont de Nemours or Double D’s, DuPont, (DD), has been a mainstay in the chemicals business forever. With a $59 billion market cap, it has shown staying power for the long run. But its stock chart is now also showing some strength and the potential for a big move higher, if that 2.90% dividend yield was not enough to get you involved. Take a look:
The weekly chart above shows several reasons to consider buying the stock. The bearish Deep Crab (green triangles) suggests that there is room to go to 68 before a pullback.
The current consolidation would target 67 on a break higher as indicated by the Measured Moves (dotted blue line). The 20 week Simple Moving Average (SMA) has played a key role in supporting the price action and is trending higher. The momentum indicators, RSI and MACD are both positive, with the RSI running sideways at the 70 level and the MACD flat in this consolidation. Finally, the accumulation/distribution statistic shows accumulation persisting despite the price level. From a technical perspective a move over 62.25 would trigger an entry and a drop back under 60 would mean it was wrong.
Disclosure: The information in this blog post represents my own opinions and does not contain a recommendation for any particular security or investment. I or my affiliates may hold positions or other interests in securities mentioned in the Blog, please see my Disclaimer page for my full disclaimer.
Original post
