
Dunkin' Brands Group, Inc. (NASDAQ:DNKN) reported strong fourth-quarter 2017 results, exceeding the Zacks Consensus Estimate on both counts.
Adjusted earnings of 64 cents per share beat the Zacks Consensus Estimate of 63 cents. Earnings, however, stayed flat year over year, as a decline in adjusted net income was offset by decline in shares outstanding.
Revenues increased 5.3% year over year to $227.1 million. The top line also surpassed the consensus mark of $223 million. The improvement was on the back of a rise in franchise fees owing to additional renewal income, offset by a decline in gross openings.
The increase in revenues was offset by a decline in sales of ice cream and other products, to the company’s licensees in the Middle East, and a decline in royalty income mainly because of an extra week in the prior-year period as well as a reduction in refranchising gains. The company’s system-wide sales increased 2.8%, lower than 3.3% growth recorded in the prior quarter.
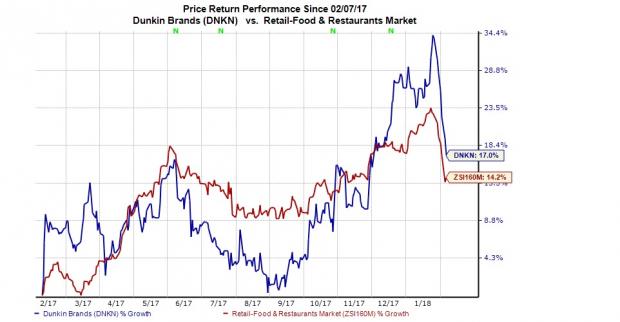
There was no stock movement in afterhours trading. Shares however have returned 17% over the past year, outperforming the industry’s 14.2% rally.
Let’s delve deeper into the numbers.
Segmental Performance
Dunkin' Brands operates through its Dunkin’ Donuts and Baskin-Robbins brands.
Dunkin' Donuts U.S. reported revenues of $177.7 million, which reflects an increase of 9% from the prior-year quarter. The upside can be attributable to higher franchise fees, partly offset by a decline in royalty income because of the extra week in the prior-year period. Comps increased 0.8%, comparing unfavorably with 1.9% growth in the prior-year quarter.
Dunkin’ Donuts International division reported revenues of $5.6 million, reflected a decline of 6% from the prior-year quarter. Comps increased 1.6% against a 1% decline in the prior-year quarter.
Baskin-Robbins U.S. revenues were up 11.9% from the prior-year quarter to $10.6 million. The increase was mainly due to higher sale of ice cream and other products and an increase in franchise fees, partly offset by lower other revenues. Comps increased 5.1% against 0.9% decline in the year-ago quarter.
At Baskin-Robbins International division, revenues were down 12.3% from the prior-year quarter to $25.8 million. The downtrend was mainly due to decline in sales of ice cream products to licensees in the Middle East, partly offset by increases in royalty income and other revenues. Comps improved 3%, better than 0.7% rise in the prior-year quarter.
Operating Performance
Adjusted operating income rose 9.2% from the year-ago quarter to $123.5 million mainly as a result of higher revenues. The upside was partly offset by an increase in occupancy expenses related to franchised restaurants, and general and administrative expenses. Adjusted operating income margin was however down 90 basis points to 54.4%.
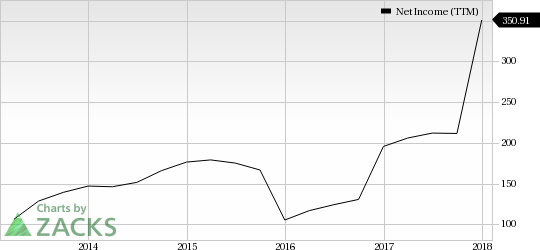
Dunkin' Brands Group, Inc. Net Income (TTM)
Balance Sheet
Dunkin' Brands exited the fourth quarter with cash and cash equivalents of $1 billion, compared with $267 million at the end of the prior quarter. Restricted cash was $94 million, up from $76.1 million in the previous quarter. Accounts receivables were $51.4 million, down from $77.4 million in the prior quarter. Long-term debt was approximately $3 billion.
Store Update
In the quarter under review, Dunkin' Brands opened 141 net new restaurants worldwide. These include 126 net new Dunkin' Donuts U.S. locations, 40 net new Baskin-Robbins International outlets. However, the company reported 23 Dunkin' Donuts International net closures and 2 Baskin-Robbins U.S. net closures. Additionally, Dunkin' Donuts U.S. franchisees remodeled 88 restaurants while Baskin-Robbins U.S. franchisees renovated 34 outlets.
Zacks Rank and Key Picks
Dunkin' Brands carries a Zacks Rank #2 (Buy). You can see the complete list of today’s Zacks #1 Rank (Strong Buy) stocks here.
Other top-ranked stocks in the same space are Darden Restaurants (NYSE:DRI) , BJ's Restaurants and (NASDAQ:BJRI) and Brinker International (NYSE:EAT) , each carrying a Zacks Rank #2.
Long-term earnings growth rate for Darden, BJ's Restaurants and Brinker is projected to be 10.9%, 15.3% and 13.5%, respectively.
Zacks Top 10 Stocks for 2018
In addition to the stocks discussed above, would you like to know about our 10 finest buy-and-hold tickers for the entirety of 2018?
Last year's 2017 Zacks Top 10 Stocks portfolio produced double-digit winners, including FMC Corp (NYSE:FMC). and VMware which racked up stellar gains of +67.9% and +61%. Now a brand-new portfolio has been handpicked from over 4,000 companies covered by the Zacks Rank. Don’t miss your chance to get in on these long-term buys.
Access Zacks Top 10 Stocks for 2018 today >>
BJ's Restaurants, Inc. (BJRI): Free Stock Analysis Report
Darden Restaurants, Inc. (DRI): Free Stock Analysis Report
Dunkin' Brands Group, Inc. (DNKN): Free Stock Analysis Report
Brinker International, Inc. (EAT): Free Stock Analysis Report
Original post