For the forex markets, Friday was a curious yet dramatic day. Traditionally the 2nd of January tends to be associated with a gradual return to work following the extended Christmas and New Year celebrations, resulting in muted trading on thin volume.
This year was anything but the case, with the principle FX majors all offering excellent trading opportunities, and in addition moving through key technical levels as the next phase of price action builds. And especially cable, which is our starting point, as we look at the GBP/USD, the AUD/USD, the EUR/USD and finally the CAD/USD all on the daily chart for the March futures contract.
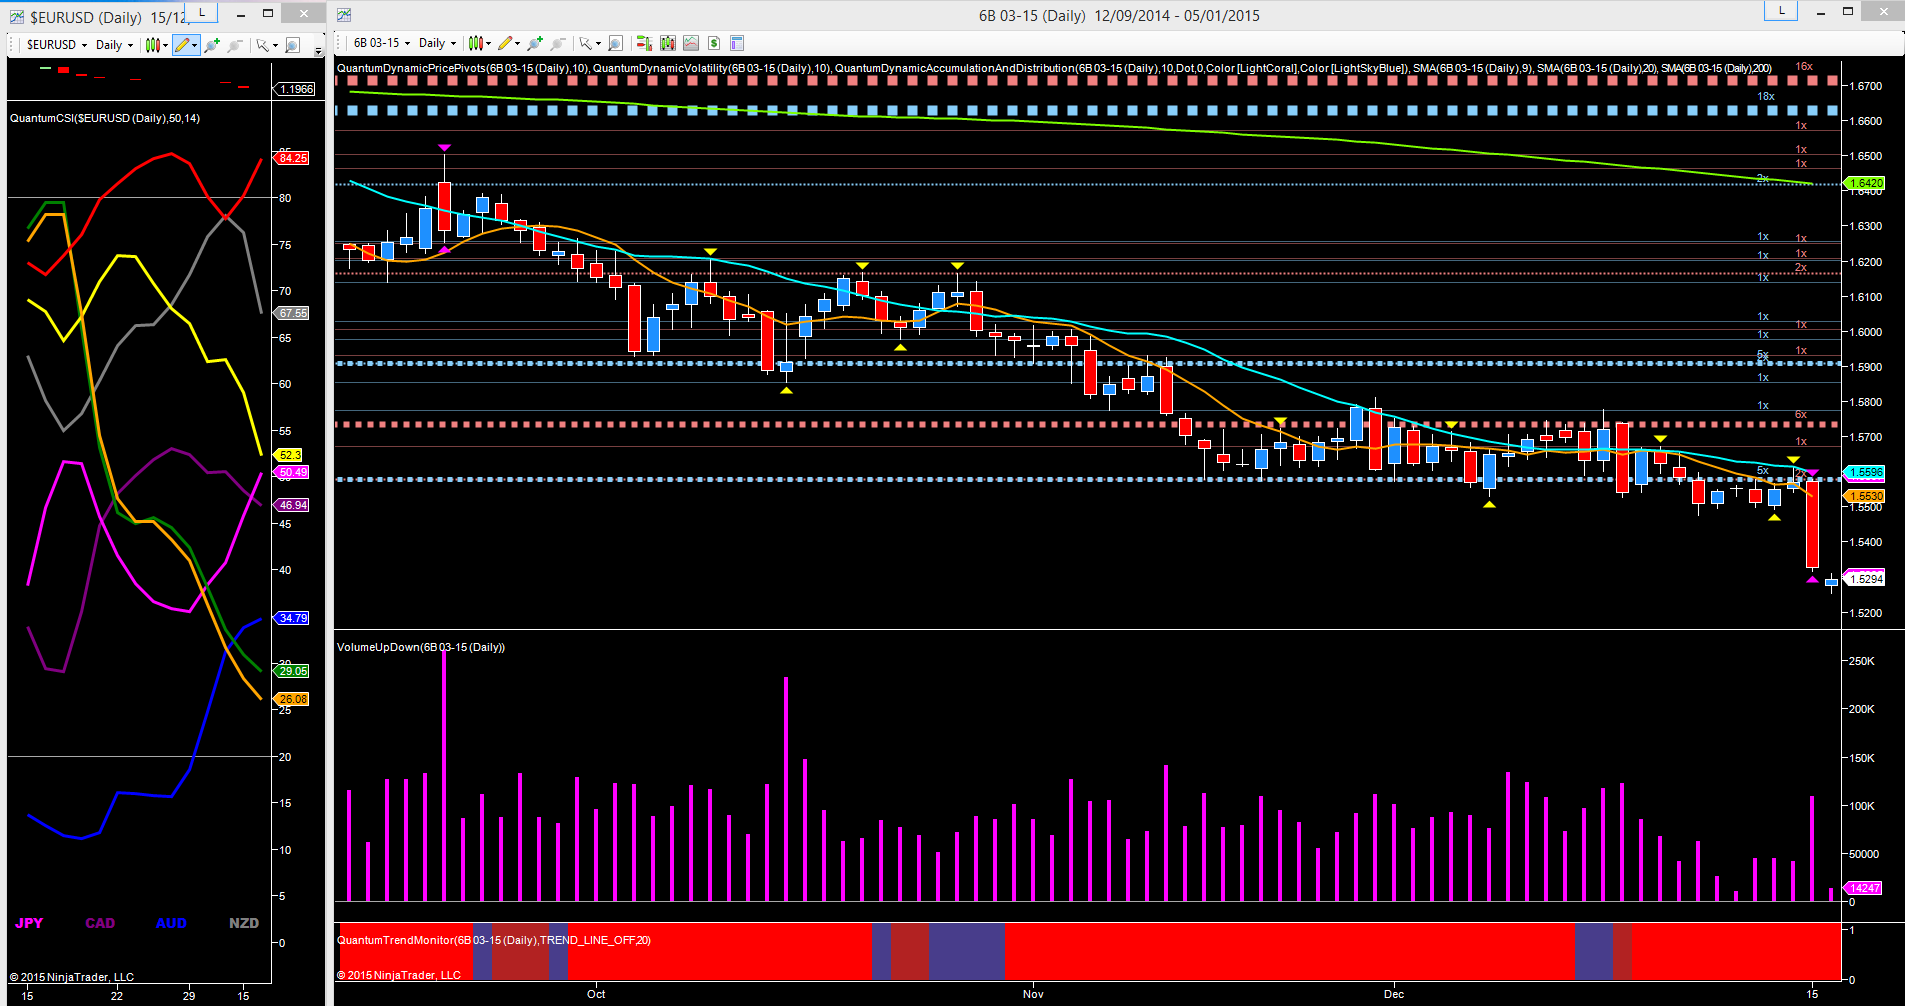
For the GBP/USD it was the combination of weak economic data combined with continued strength in the US dollar which finally delivered the knockout punch, driving the pair through the well developed platform of support in the 1.5450 price region and closing with a wide spread down candle on high volume. For sterling it was the weaker than expected PMI data reflecting a slowdown in manufacturing, which was the initial trigger, as the pair fell to their lowest level in 18 months, while the price action for the US dollar saw the USD index climb firmly through the 91 region to close at 91.49. This combination of factors has also set up cable for the next leg of its downward trend.
Friday was therefore a seminal day, with the breakdown confirmed and with December’s deep area of price congestion now weighing heavily, we can expect to see the pair fall further down to test the next significant level of support in the 1.5100 region. Should this be breached (as expected), then a deeper move lower is likely with a move towards the 1.4950 region in the longer term.
The currency strength indicator to the left is confirming this picture for the British pound, with the yellow line descending sharply and with a long way to go before reaching an oversold state. For today, it will be interesting to see if the construction PMI data follows the same pattern as for the manufacturing PMI of Friday, with the forecast of 59.2 showing a slight decline from last month’s 59.4.

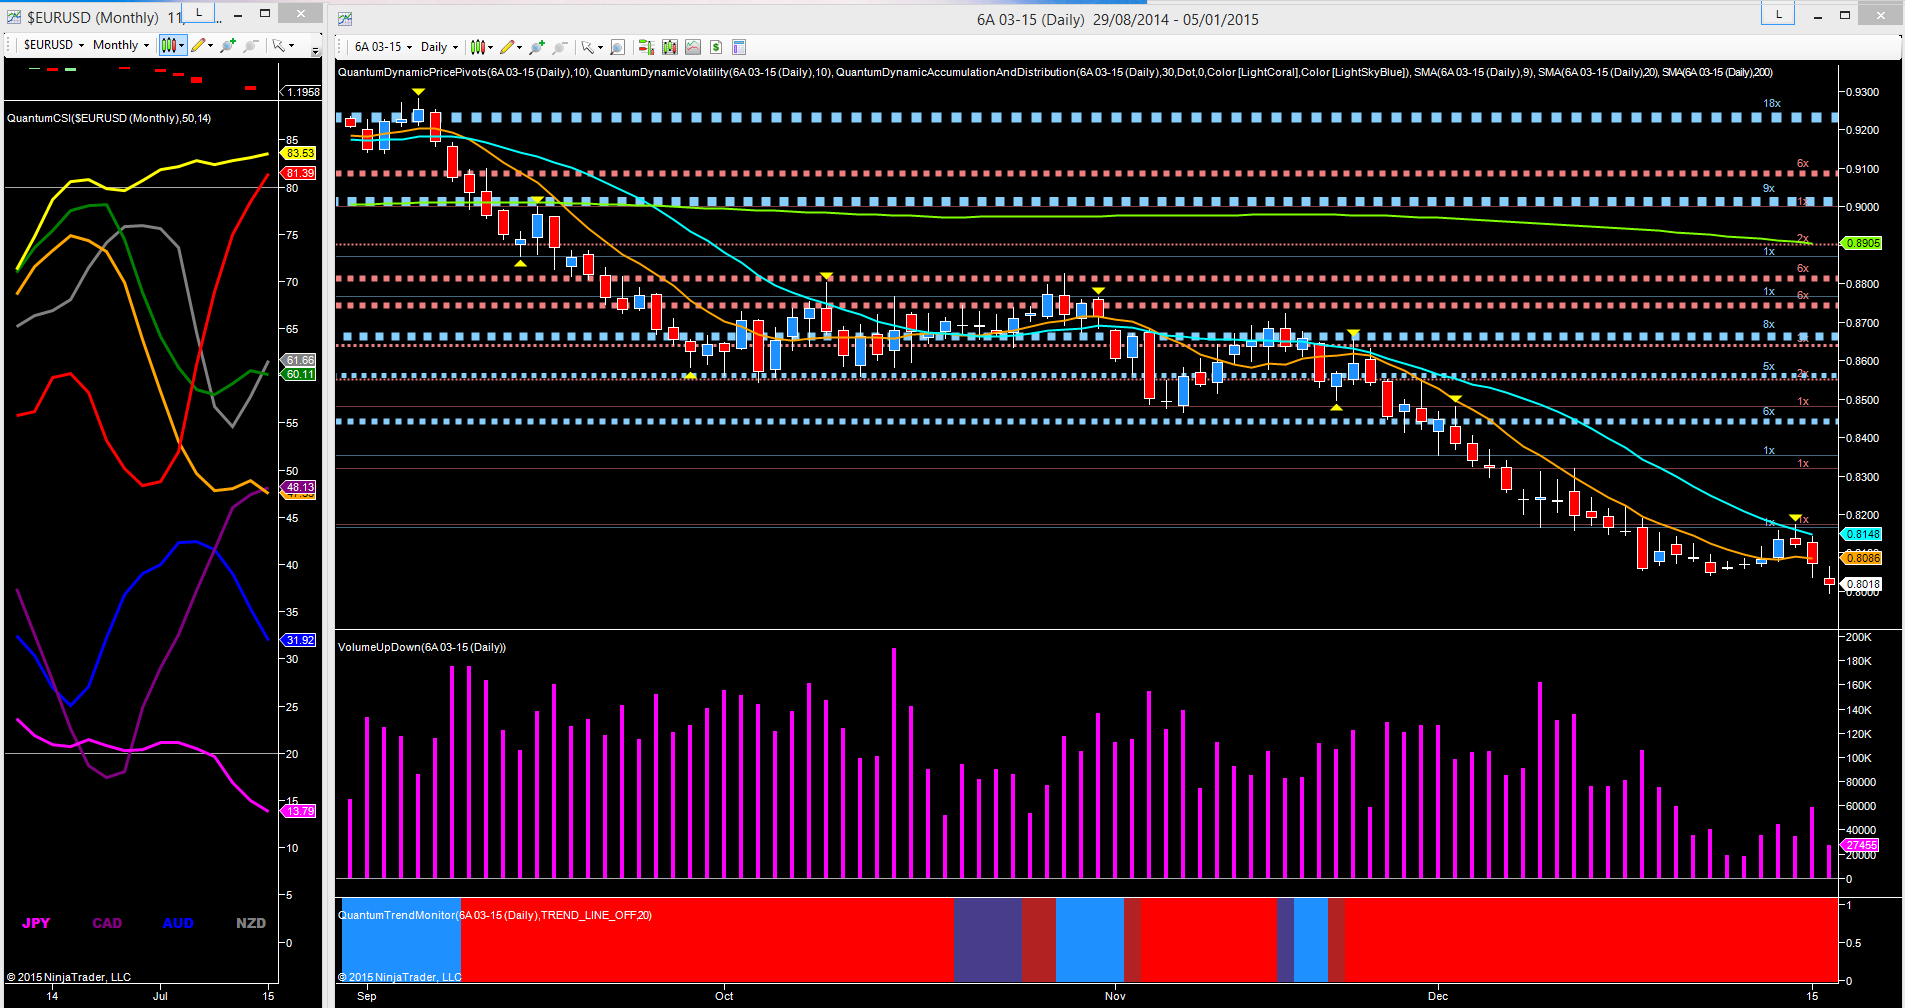
Moving to the AUD/USD, the bearish tone here was more muted, and whilst the pair managed to cling on to the platform of support built in the second half of December in the 0.8050 region, overnight and this morning, the price action the AUD/USD has finally broken below to trade at 0.8019 (at time of writing), thereby signalling a pick up in the bearish momentum once again.
Friday’s price action also triggered a pivot high on the daily chart, adding a further layer of weakness to the technical picture. With the RBA overtly encouraging a weak Australian dollar, and coupled with a resurgent US dollar, the next level of potential support now awaits in the 0.7600 region, with the longer term currency strength indicator to the left also confirming the negative picture at present for the Aussie dollar.

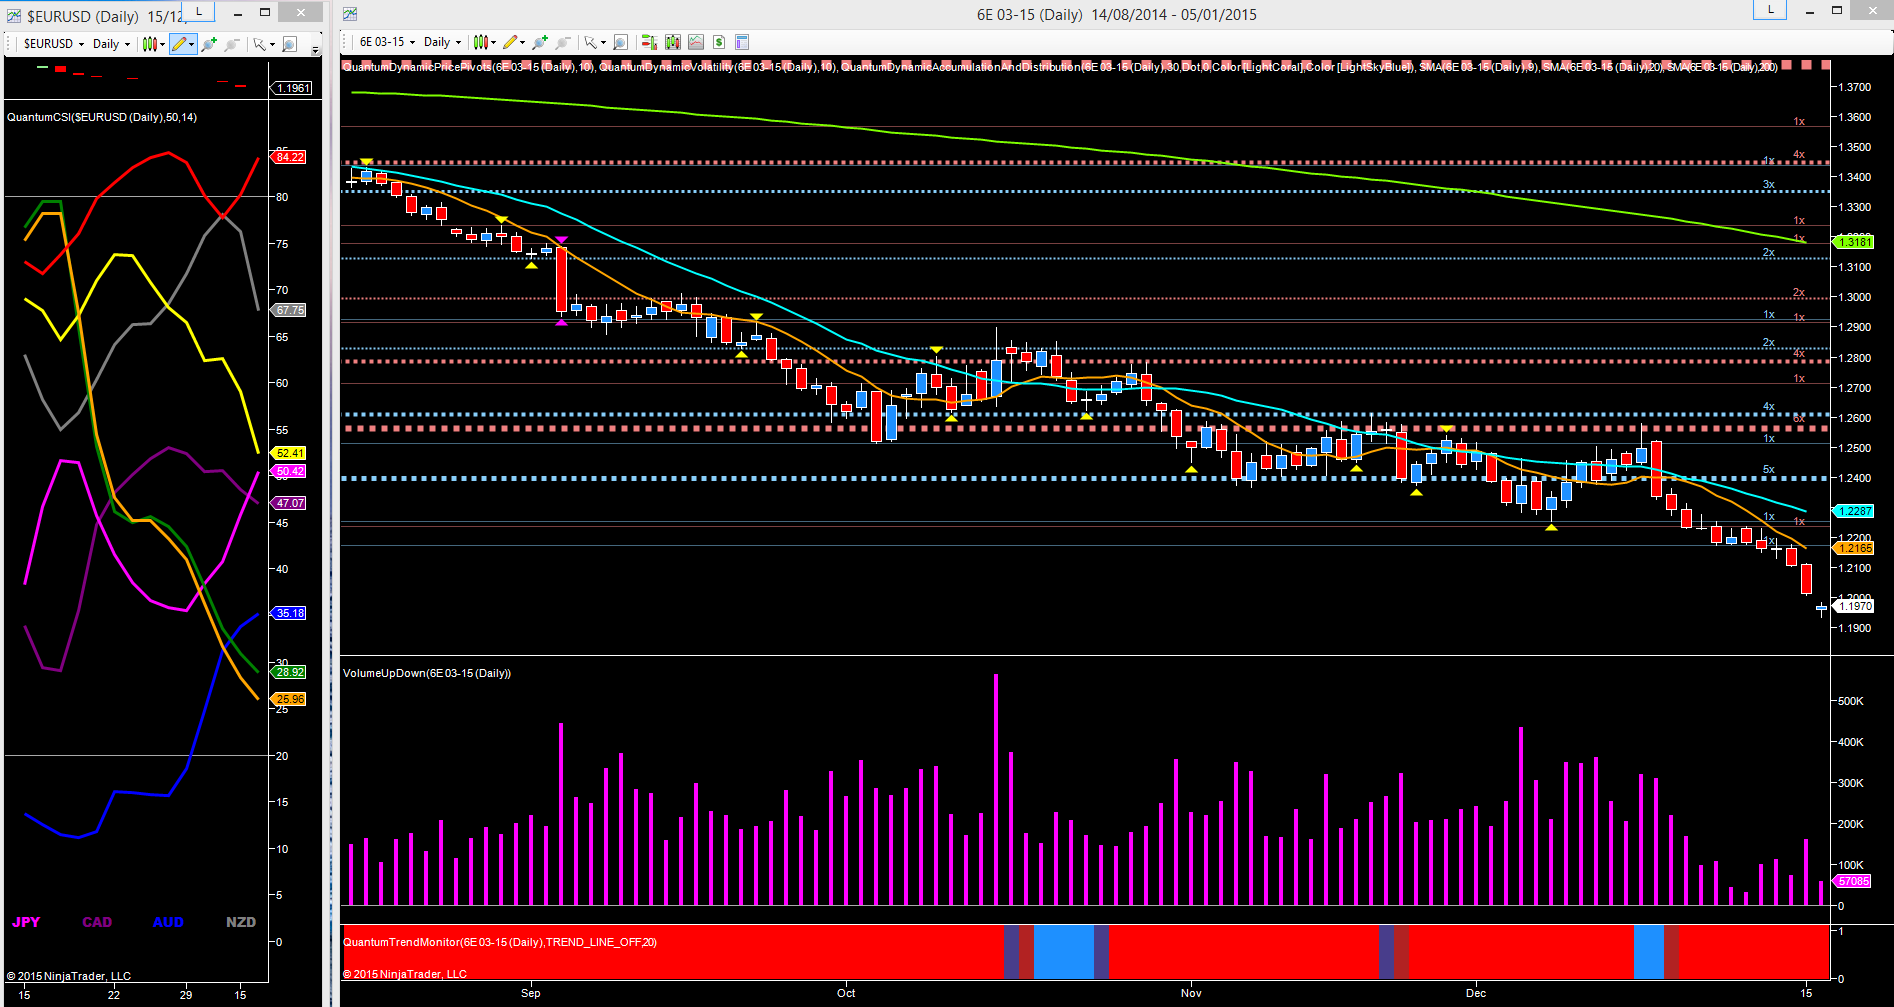
For the EUR/USD, Friday was merely a day which saw an increase in bearish momentum for the pair as it closed with a wide spread down candle on rising volume, confirming the heavily negative picture for the euro at present. This sentiment has continued in early trading in London with the pair now well below the psychological 1.2000 level at 1.1969 at the time of writing. With little potential support now available, the trapdoor is well and truly open, and with the fundamental and technical aspects aligning up positively for the US dollar, and negatively for the euro, further falls are inevitable, possibly towards the 1.1540 region or below in the longer term.
Today there will be the release of German CPI with a forecast of 0.1% against a previous of 0%, but even if this news is better than expected, any gains are likely to be short lived given the technical picture. This is further confirmed with the currency strength indicator with the euro ( the orange line) continuing to descend steeply and with some way to go before reaching an oversold state.

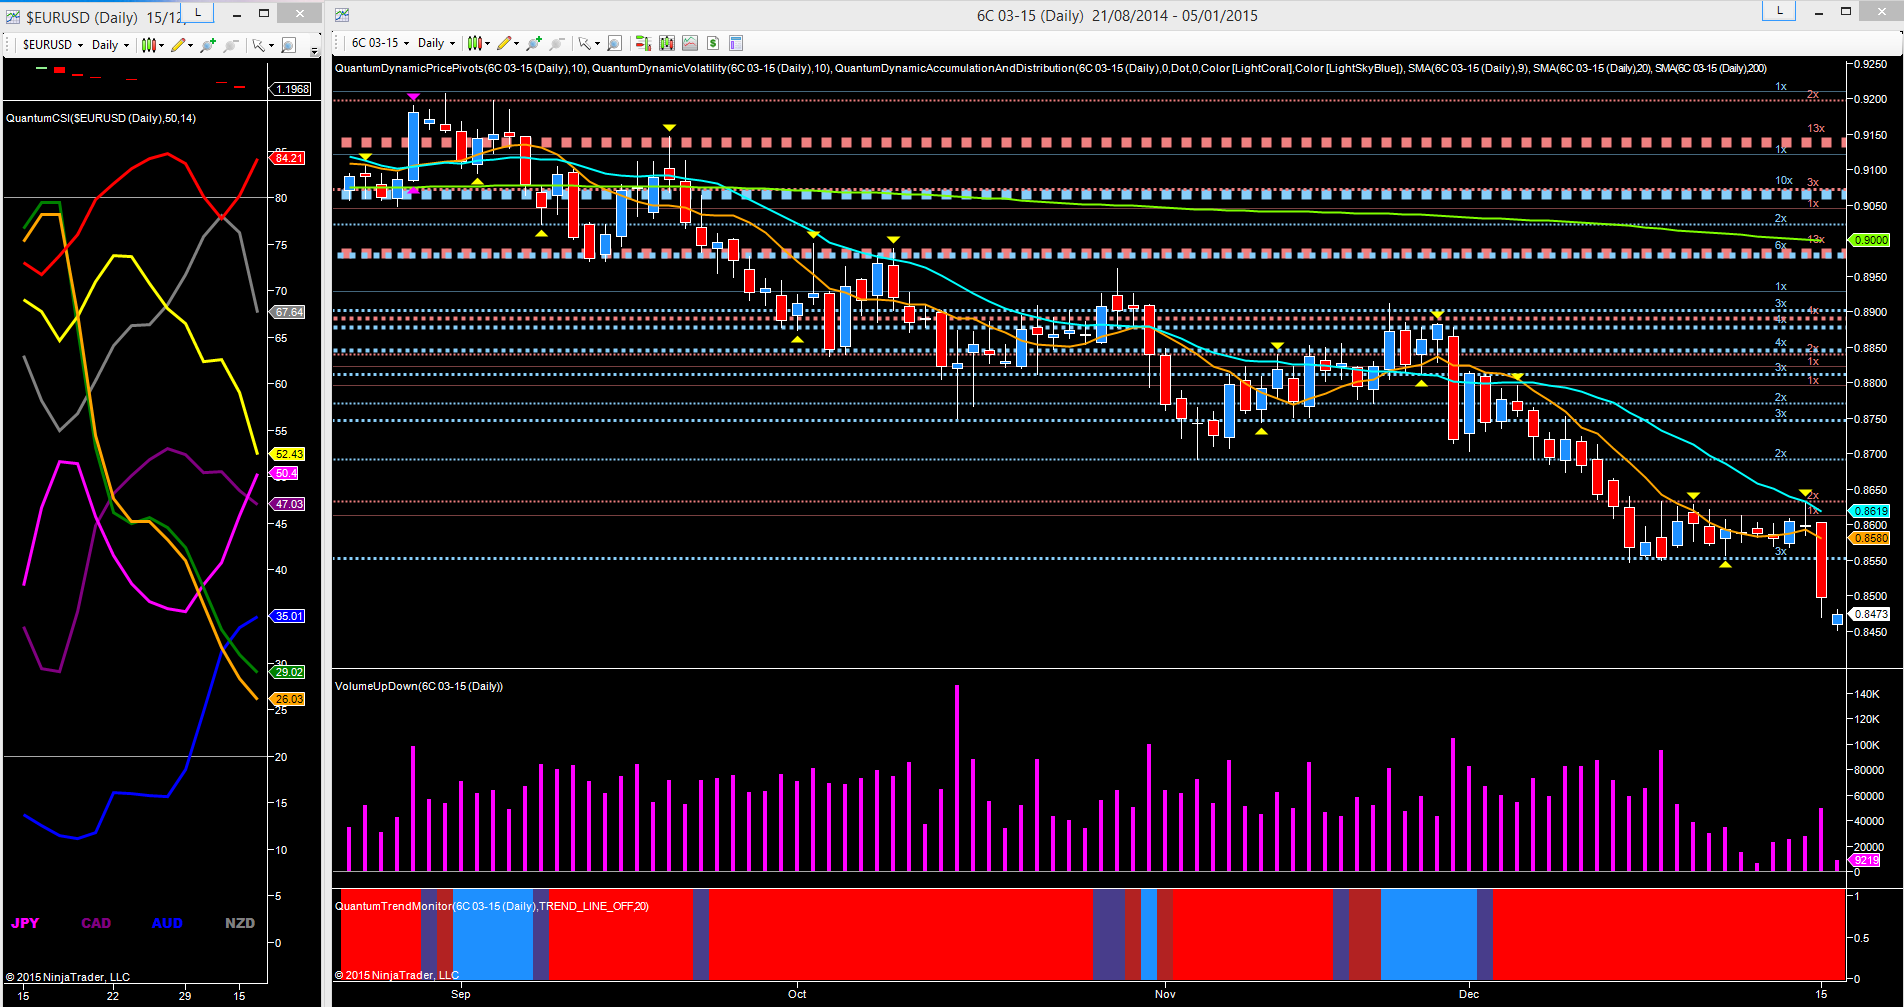
Finally to the CAD/USD which has much in common with the GBP/USD, with Friday’s price action proving to be seminal, as the pair finally breached December’s platform of support in the 0.8550 area, as defined by the accumulation indicator shown with the blue dotted line. Friday’s weakness was also reinforced with a pivot high topping out Thursday’s weak effort to rally. For the CAD/USD the primary drivers at present are once again the US dollar, but also the steep decline in oil, which now looks set to test the $50 per barrel area with further falls likely as OPEC continues to take on the alternative energy suppliers. In the longer term, expect to see the pair test the sustained platform of support now building in the 0.8100.
An interesting and perhaps surprising start to the new year for the forex markets as another trading year gets into full swing today.
